Received: March 2025
DOI 10.17677/fn20714807.2025.03.01
Fluorine Notes, 2025, 160, 1-2
EXAMPLES AND CAUSES OF PEAK-FREE ZONES IN ELECTRON IONIZATION MASS SPECTRA OF LINEAR COMPOUNDS
N.D. Kagramanov*
Federal State Budgetary Institution of Science A. Nesmeyanov Institute of Organoelement Compounds of the Russian Academy of Sciences, 119991, Moscow, Vavilov Str., 28.
*e-mail: ndkagram@gmail.com
Abstract: This communication presents examples of mass spectra of linear compounds from NIST libraries containing peak-free zones (p/f zones) at the beginning of the chain when less or more than 1/2M is detached along with the molecular ion or in the middle of the chain when +.M is retained. P/f zones tend to form and increase in proportion to the molecular masses of the homologs. P/f zones at the beginning of the spectrum are characteristic of the spectra of linear symmetric compounds with regular but inhomogeneous chain structure, when due to the decay of M/2 or close to M/2 a part of the chain is broken off and the first fragment ion of the spectrum appears. In the spectra of ethylene glycol homologs of bis-trifluoroacetates C8-C30, the mass of the detached radical and, accordingly, the p/f zone increases from 63 Da to 377 Da, (from 21% to 48% M). In the spectra of anhydrides of linear perfluoroalkyl acids C6F10O3-C16F30O3 a p/f zone is formed due to the central group O=COC=O, which breaks the chain homogeneity. In the spectra of linear n-alkanes and n-perfluoroalkanes p/f zones are absent because their linear chains are homogeneous. The most interesting, are the cases of large p/f zones occurring in the middle of the spectra of higher homologs in n-carboxylic acids, their methyl, ethyl, and propyl esters with masses from 700‑1000 Da. It should be noted, that in the spectra of n-carboxylic acids with molecular weights up to 700 Da, b/d zones are absent. The appearance of p/f zones at increasing molecular weight of the acid > 700 Da is apparently the result of an energy conflict between two opposite fragmentations: fragmentation of the carboxyl group with an energetically acceptable hydrocarbon part of the chain, and of the molecular ion with an energetically unacceptable hydrocarbon group. The reason for the conflict is probably the deficit of excitation energy insufficient for the consecutive fragmentation of the whole +.М chain. Instead of sequential fragmentation, a more economical chain break occurs, with a significant portion of the chain being ejected along with the +.M without fragmentation, with a minimum of energy. The remaining fragment of the spectra with a carboxyl or ester group acquires less energy than if it had acquired it directly by ionization of its molecular ion. When a peak-free zone occurs, the light, registerable spectrum fragment usually retains its original functional group and its new molecular ion. However, due to the lack of excitation energy, the peak intensities of the fragment, characteristic of an acid or ester, differ from the peak intensities of this compound obtained directly by ionization of its native molecular ion.
Keywords: peak-free zones of mass spectra, p/f zones in the middle of spectra, spectra of higher homologs of carboxylic acids, spectra of esters of carboxylic acids with masses 700-1000 Da.
Examples of disruption of chain uniformity in the spectrum of pentadecafluorooctanoic acid anhydride and mutual counteraction of two stabilizing terminal groups in the spectra of polyethylene glycol bis-trifluoroacetates
The most obvious example of disruption of the perfluoroalkyl chain homogeneity is the mass spectrum of pentadecafluorooctanoic acid anhydride (Figure 1).
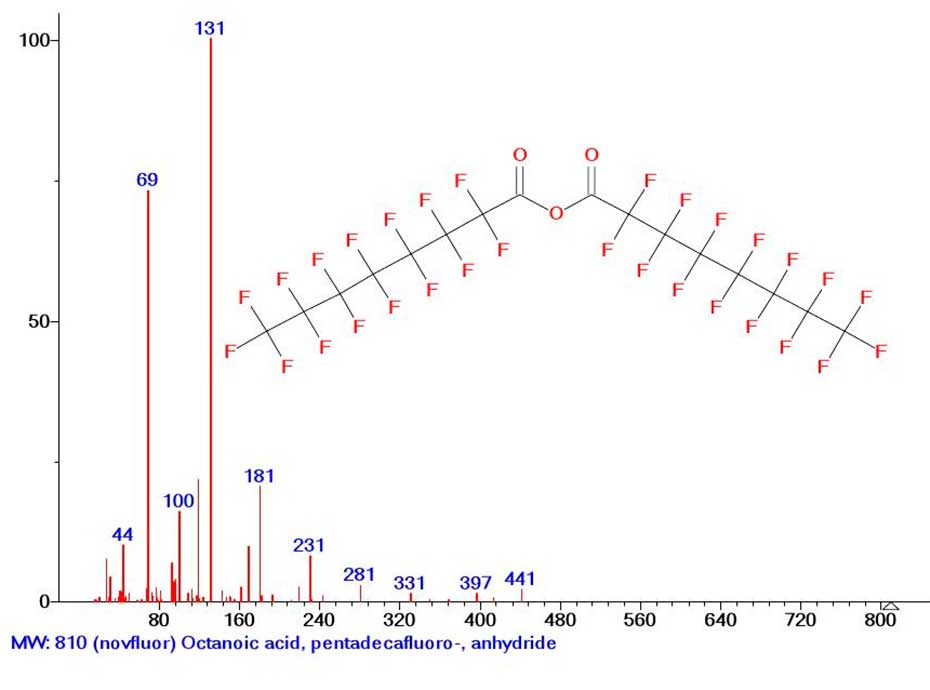
Figure 1. Mass spectrum of pentadecafluorooctanoic acid anhydride MW: 810 C16F30O3
MW: 810 NIST#: 73744 ID#: 142932 DB: mainlib
Due to the disruption of the perfluoroalkyl chain (Figure 1.) by the (O=C-O-C=O) group, the first fragment peak of the mass spectrum of pentadecafluorooctanoic acid anhydride with m/z 441 results from the detachment of the .C7F15 radical with mass (-369 Da).
Another example of the appearance of a large peakless region of the spectrum for no apparent reason is the mass spectrum of polyethylene glycol bis-pentafluoroacetate (Figure 2.).
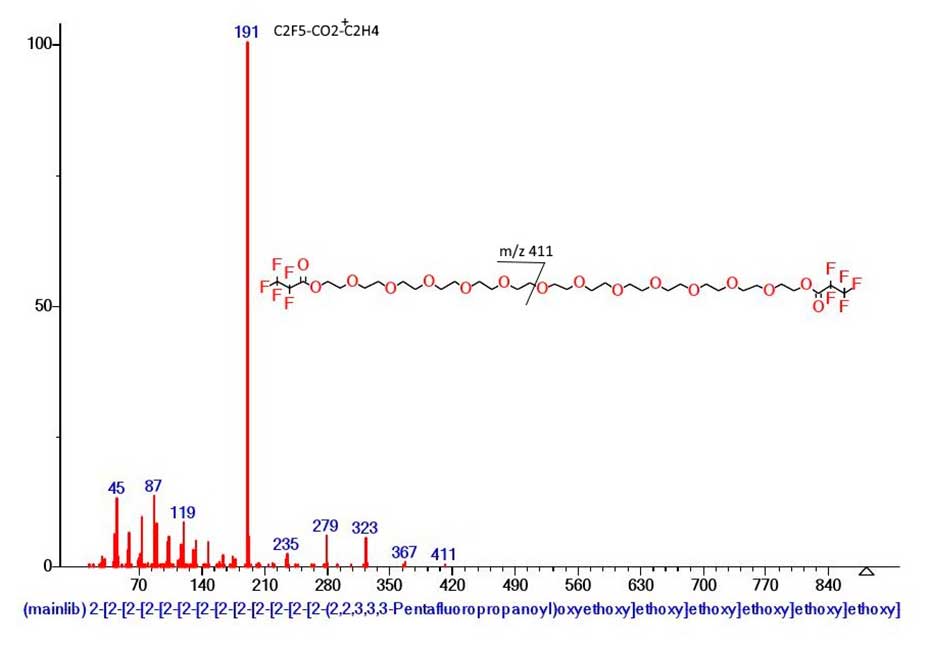
Figure 2. Mass spectrum of polyethylene glycol bis-pentafluoroacetate MW: 882 NIST#: 351990 ID#: 221406 DB: mainlib.
As a result of ionization, more than half of the molecular cation radical, namely 471 Da (‑.OC2H4(OC2H4)6OC=OC2F5) breaks off as a radical. The detachment gives rise to the C2F5‑C=OO(C2H4 O)5CH2+CH2 ion with m/z 411 (0.1%). After five successive emissions of C2H4O (‑220), the base ion of the mass spectrum, with m/z 191 C2F5C=OO-CH2+CH2, is formed. Its base intensity is the result of coordination interaction between the oxygen atom of the carbonyl group and the hydrogen atom of the terminal methylene group, strengthening the ion with m/z 191. Similar strengthening of the chain with m/z 471 by the opposite terminal C=O group results in the chain breaking off, in the form of a radical.
That is, strengthening coordination bonds of oxygen atoms of terminal carbonyl groups with hydrogen atoms of methylene groups of the chain are directed opposite to each other. With increasing molecular weight of polyethylene glycol homologues of bis-pentofluorofluorofcetates p/f, the area of their spectra increases.
Peakless zones in the spectra of higher homologs of n-carboxylic acids
Earlier, in the work devoted to McLafferty rearrangements [1], two main carboxyl ion series of their spectra were established in the mass spectra of homologs of n-carboxylic acids С6-С30 [2].
Thus, in the spectrum of pentadecanoic acid С15H30O2 MW:242 NIST#: 352553 ID#: 47430 DB: mainlib (Figure 3) after the initial detachment of the .CH3 radical, ethylene molecule and subsequent ethylene detachments, the first main ion series appears, marked in red.
It is completed by two rearrangement carboxyl ions: the doubly protonated ion CH2=C-O+H2(OH) with m/z 61(23%), and an intense protonated ion .CH2-C=O+H(OH) with m/z 60 (93%) (Figure 3). Double protonation of ion with m/z 59 to form ion with m/z 61 is due to the detachment of acetylene molecule (instead of ethylene molecule) from ion with m/z 87.
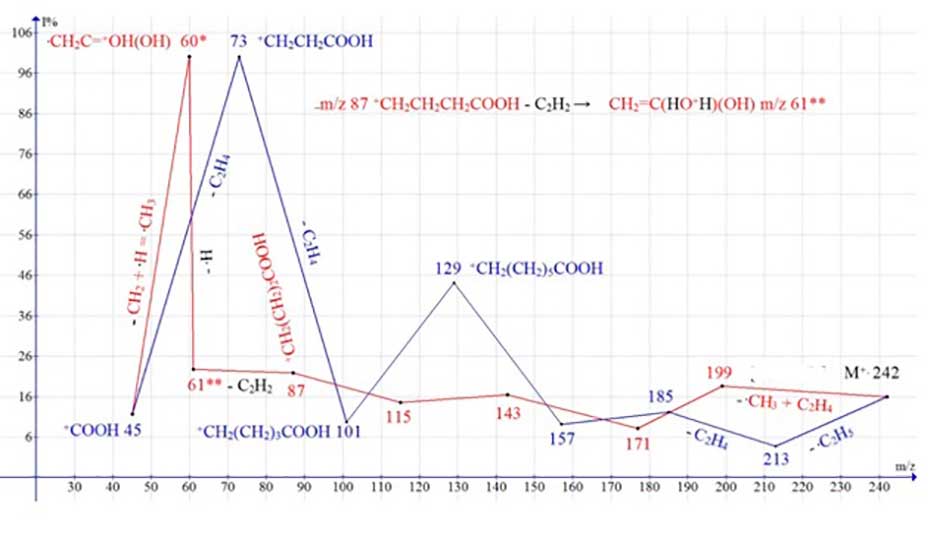
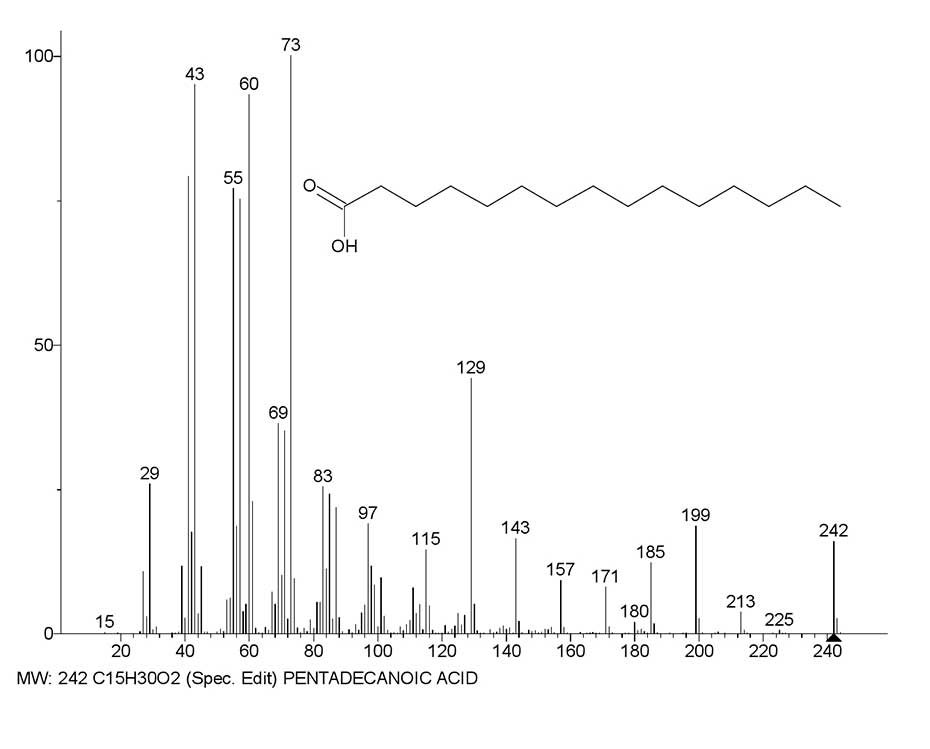
Figure 3. Mass spectrum of pentadecanoic acid C15H30O2 MW:242 NIST#: 352553 ID#: 47430 DB: mainlib; and plots of two series of ions of its spectrum, with real peak intensities.
The second ion series, marked in blue (Figure 3), results from the initial detachment of the ethyl radical and subsequent ethylene emission. It ends with the basic, non-protonated fragment ion +CH2CH2 COOH with m/z 73 (100%). Thus, in the spectrum of С15H30O2 rearrangement and non-rearrangement fragmentation processes preserving the carboxyl group occur with the same or close efficiency.
In the spectrum of pentadecanoic acid, in addition to these two ionic series, two more ionic series occur with the detachments of the methyl as well as ethyl radical (Figure 3), which destroy the carboxyl group. They start from the opposite terminal group, namely the carboxyl group (Figure 4).
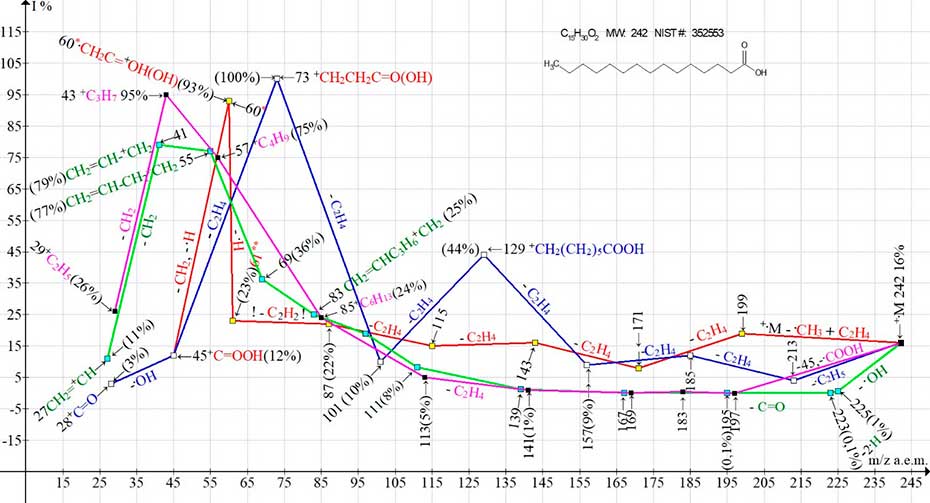
Figure 4. Two pairs of competing ion series (2-carboxyl and 2 alkyl) of the mass spectrum of pentadecanoic acid.
The detachment of the entire carboxyl group (+.M-.COOH M-45) gives rise, marked in purple, to the alkyl ion series, culminating in an intense peak with m/z 43 +C3H7 (95%). The second carboxyl group detachment (light green series) occurs in three steps. First, the hydroxyl radical is detached, followed by the detachment of two hydrogen atoms from the opposite terminal group of C2H5 to form a stabilizing terminal allyl group (CH2=CH).
Then C=O emission occurs, with the formation of an allylic ion series with an intense peak (m/z 41 +C3H5 79%). In the spectrum of pentadecanoic acid, these two pairs of competing ion series, from two different terminal groups occur with equal or close efficiency.
With increasing molecular weight of carboxylic acid homologs in the mass range MW:172 С10H20О2–452 C30H60O2, there is a decrease in the intensity of the peaks of carboxyl ions of both rearrangement ions with m/z 61 and m/z 60 and non-rearrangement ion with m/z 73 (Figure 5).
The Figure 5 shows the mass spectrum of triacontanoic acid.
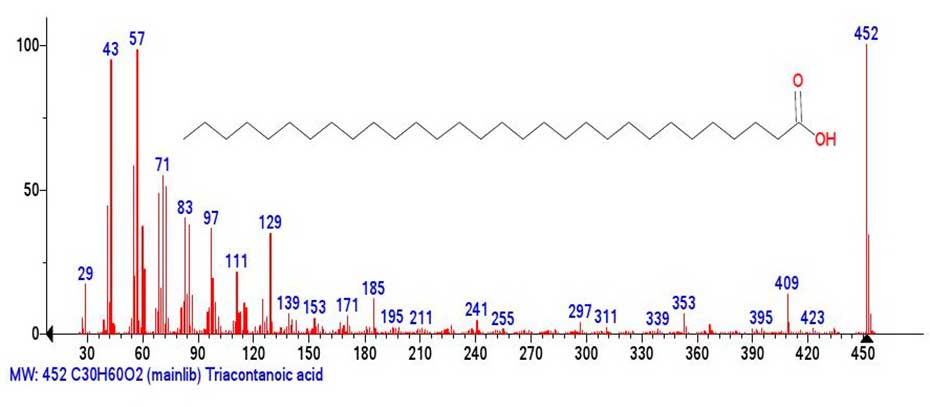
Figure 5. Mass spectrum of triacontanoic acid С30H60O2 MW:452
NIST#: 228020 ID#: 304389 DB: mainlib.
The base peak of the spectrum (Figure 5.) becomes the peak of the molecular ion, and the most intense fragment peak is the peak of the alkyl ion with m/z 57 +C4H9 (98%). The intensities of other alkyl peaks with m/z 29, 43 +С3H7,71 +С5H11, 85 +С6H13 also increase. The intensities of the main carboxyl peaks with m/z 61(22%), m/z 60(39%), m/z 73(51%) decrease, and the intensities of the carboxyl peaks in the middle of the mass spectrum acquire minimal intensities. With further increase of molecular weight of carboxylic acid homologs, extensive peak-free regions appear in the middle part of their spectra.
An example of such spectra is the mass spectrum of gentetetracontanoic acid (Figure 6). The peak of the molecular ion is basic, but it is somehow not very prone to fragmentation.
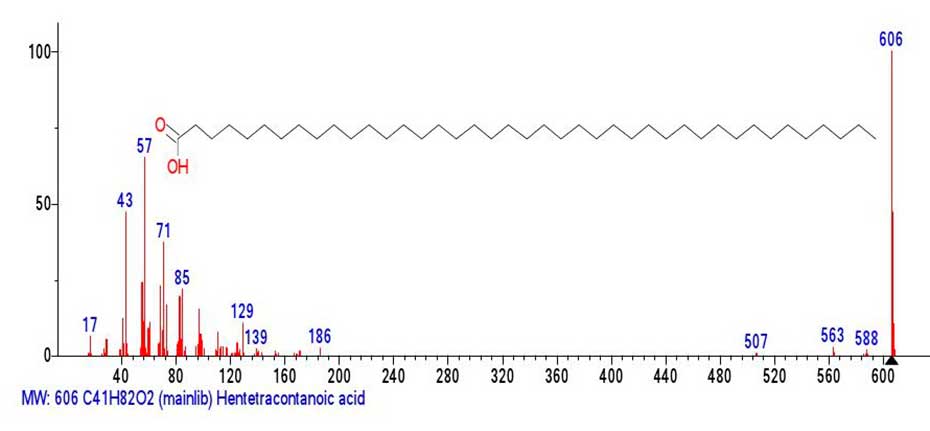
Figure 6. Mass spectrum of genetetetracontanoic acid С41H82O2 MW:606
NIST#: 33413 ID#: 242137 DB: mainlib.
The first fragment peak of the mass spectrum (Figure 6.) with m/z 588 corresponds to the detachment of H2O from the carboxyl group to form the terminal group O=C=CH-. The next two detachments are M-43 (-.C3H7) with m/z 563 and M-99 (-.C7H15)=m/z 507) occur in the alkyl ion series, from the opposite terminal group. After the detachment of M-99 up to the ion with m/z 186, a peak-free zone 507-186=321 occurs, which can be interpreted as the result of the detachment of the allylic radical .СH2(СH2)20CH=CH2 with m/z 321.
Judging from the fragmentation 186-171=15(-СH3), the radical cation with m/z 186 is probably a “molecular” ion C11H22O2 resembling +.M undecanoic acid or its isomer.
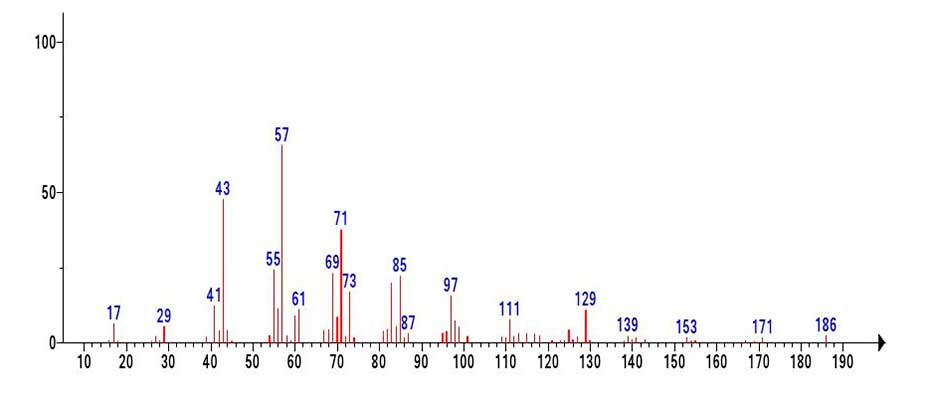
Figure 7. Mass spectrum of the C11H22O2 MW:186 fragment emulated from the mass spectrum of genetetetracontanoic acid С41H82O2 (Figure 6).
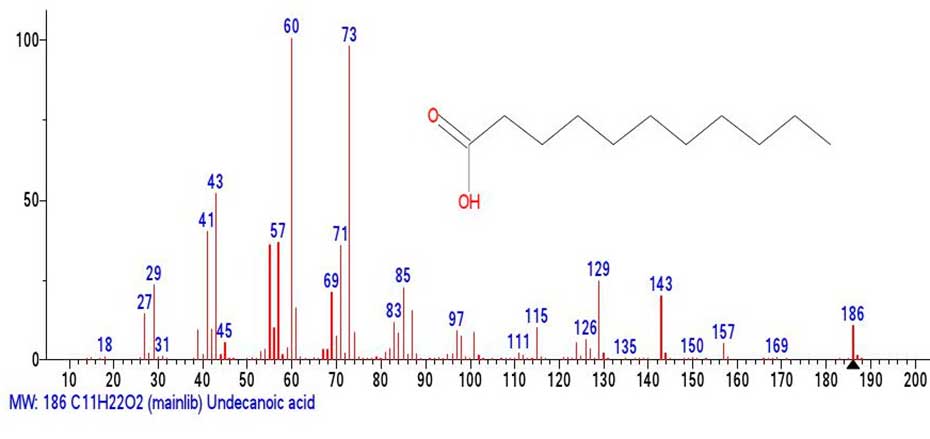
Figure 8. Mass spectrum of undecanoic acid C11H22O2 MW:186
NIST#: 229862 ID#: 35951 DB: mainlib.
Comparison of the emulated C11H22O2 fragment (Figure 7) with the known mass spectrum of undecanoic acid (Figure 8) allows us to conclude that although the peak intensities of the fragment spectrum differ from those of the undecanoic acid spectrum presented in (Figure 8) the fragment (Figure 7) contains all the characteristic peaks of undecanoic acid.
In the mass spectrum of undecanoic acid (Figure 8), as well as in the spectrum of pentadecanoic acid C15H30O2 the two characteristic and most intense peaks are those containing the carboxyl group. These are the rearrangement base ion peak with m/z 60 .СH2C(HO+H)(OH) (100%) and the non-rearrangement peak with m/z 73 +С2H5COOH (98%). In the mass spectrum of the fragment (Figure 7) emulated from the spectrum of С41H82O2, the intensities of the peaks with m/z 60 and m/z 73 are only 14% and 26%.
This is the result of the competition of the two types of fragmentation as the molecular weight of the carboxylic acids increases. The result of a decrease in the intensities of carboxyl ions and an increase in the intensities of alkyl ions that occurs with increasing molecular weight of carboxylic acids, particularly gentetetracontanoic acid.
In the mass spectrum (Figure 7) the most intense peaks become the peaks of alkyl ions with m/z 43 (72%) +C3H7, m/z 57 (100%) +C4H9 and m/z 71 (57%) +C5H11. The ratio of the informative part of the spectrum to the molecular weight of the homologue is 1/3.26.
The Figure 9 shows the mass spectrum of hexacontanoic acid C60H120O2 MW: 872.
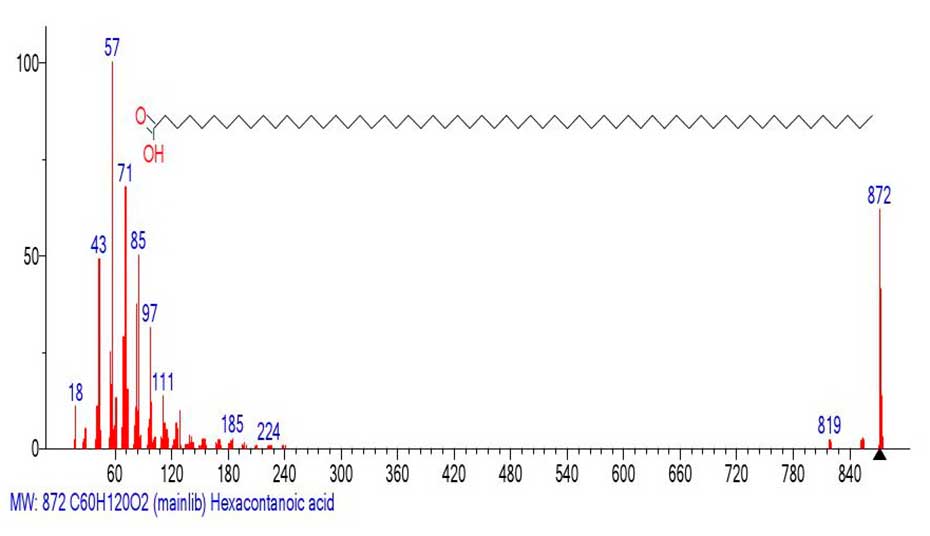
Figure 9. Mass spectrum of hexacontanoic acid C60H120O2 MW: 872
NIST#: 33414 ID#: 29367 DB: mainlib.
In the mass spectrum (Figure 9), the base peak of the spectrum becomes the peak of the alkyl ion c m/z 57, and the intensity of the molecular peak decreases to 62%. The peak-free zone between peak 819 and the first prominent peak of the spectrum is 819-241=578 Da. If we do not count the initial detachment of the water molecule 872-854=18, and the subsequent emission 872‑819=53 Da, but proceed from the initial detachment of +.M 872 -241=631 Da, to the first prominent fragment peak of the spectrum with m/z 241, the total value of the radical mass emitted is 631 Da.
The emission at 631 Da can be interpreted as a detachment of the methyl radical 631-CH3 (‑15)=616, and the subsequent emission of twenty-two ethylene molecules 22(C2H4)=616. This results in a radical cation with m/z 242 +.С15H30O2.
A fragment of the mass spectrum of +.С15H29O2 MW:242 emulated from the mass spectrum of hexacontanoic acid C60H120O2 is shown in (Figure 10.) MW: 872 (Figure 9).
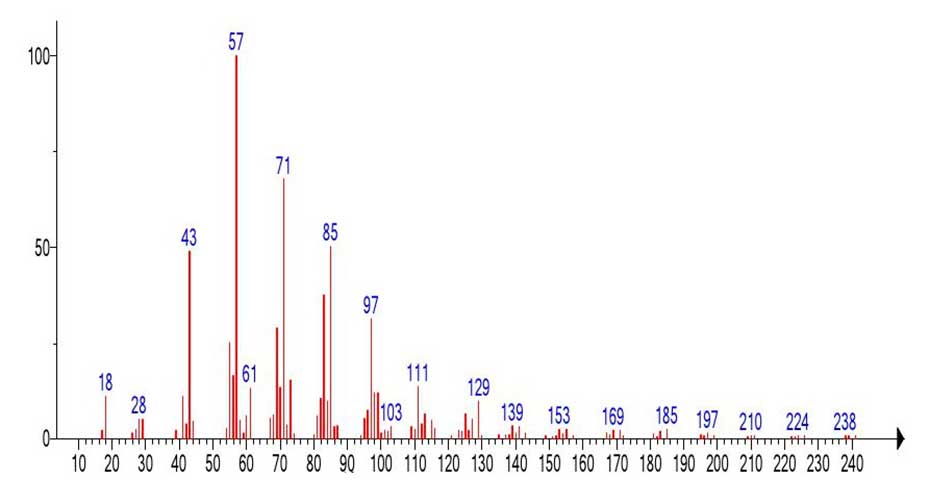
Figure 10. Mass spectrum of С15H30O2 emulated from the spectrum of hexacontanoic acid C60H120O2 MW: 872 (Figure 9).
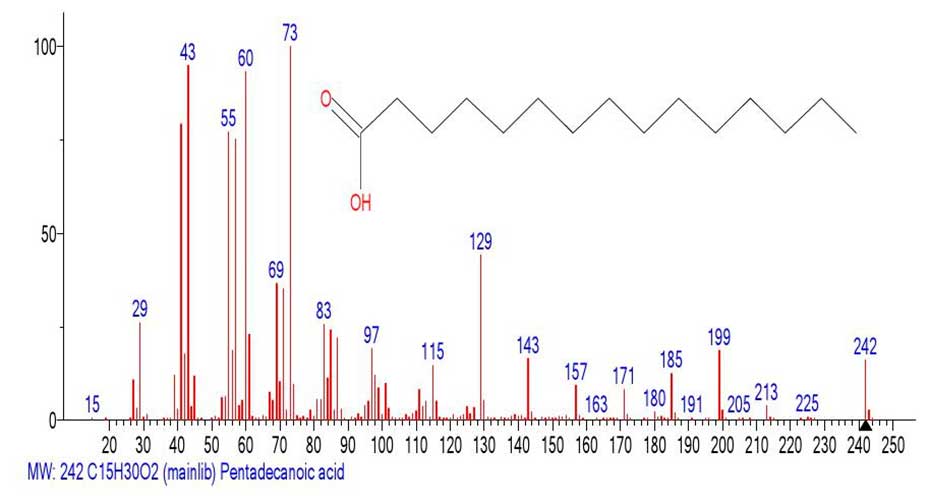
Figure 11. Mass spectrum of pentodecanoic acid C15H30O2
MW:242 NIST#: 352553 ID#: 47430 DB: mainlib.
In the spectrum of the fragment Figure 10 emulated from the mass spectrum of hexacontanoic acid (Figure 9), the presence of a prominent rearrangement peak with m/z 61 CH2=C(HO+H)(OH), its fragment ion .CH2-C=O+H(OH), with m/z 60, as well as a non-rearrangement peak +CH2CH2COOH c m/z 73 confirms the presence of a carbonyl group in it.
The intensities of these peaks in the emulated spectrum (Figure 10.) are significantly lower than in the spectrum of penodecanoic acid (Figure 11.), since this fragment of the spectrum resulted from the emission of a significant peak-free zone in the 578 Da mass spectrum of hexacontanoic acid C60H120O2. The ratio of the informative part of the spectrum to the molecular weight of the homologue is 1/3.6.
The Figure 12 shows the mass spectrum of nonahexacontanoic acid C69H138O2 MW: 998.
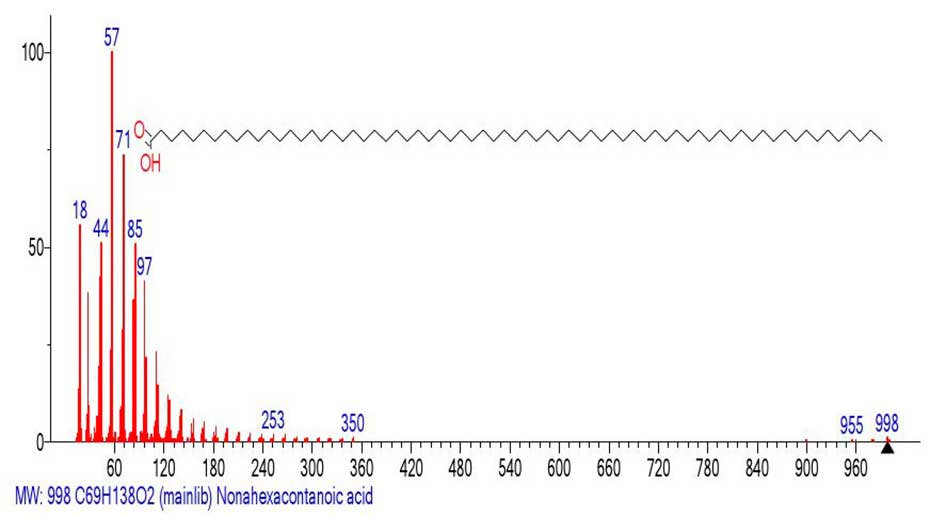
Figure 12. Mass spectrum of nonhexacontanoic acid C69H138O2
MW: 998 ID#: 28967 DB: mainlib.
In contrast to the mass spectrum of genetetetracontanoic acid С41H82O2 (Figure 6.), with a base molecular ion MW:606, the intensity of the peak of molecular ion C69H138O2 MW: 998 (Figure 10.), only 1%. Such a low intensity of the molecular ion confirms its instability. It fragments both with the detachment of the H2O molecule and the H atom, and with the ejection of the .C3H7 (M -955=43).
After detachment of the .C3H7 (-43) radical, a large peak-free zone +.M 955-605=350 (25 CH2) is ejected. The emission leads to the formation of a new molecular ion c m/z 350. (Figure 13) shows a fragment of the mass spectrum emulated from the mass spectrum (Figure 12) with m/z 350.
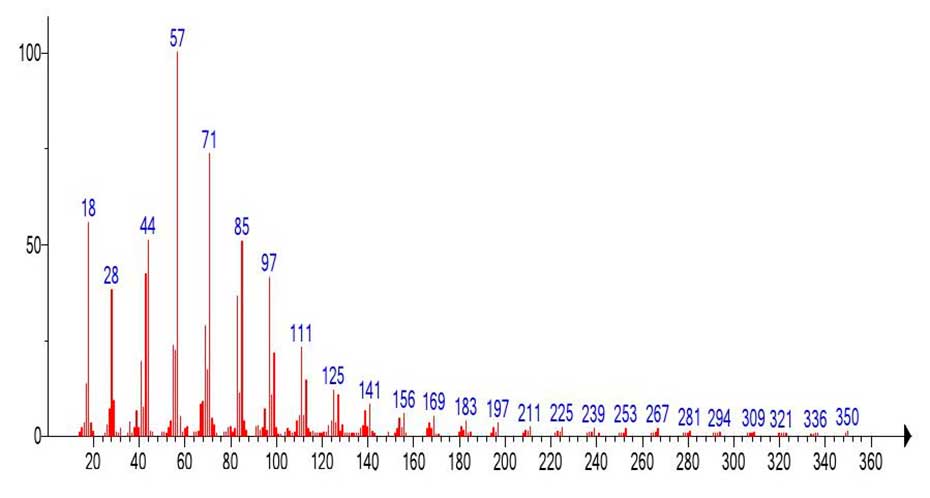
Figure 13. Spectral fragment emulated from the mass spectrum of nonahexacontanoic acid (Figure 12).
A search for a mass spectrum with molecular ion 350 in the NIST20 database concludes with several matches, the best of which is the pentаcose-1-ene mass spectrum. The Figure 14 shows the library mass spectrum of pentаcose-1-ene.
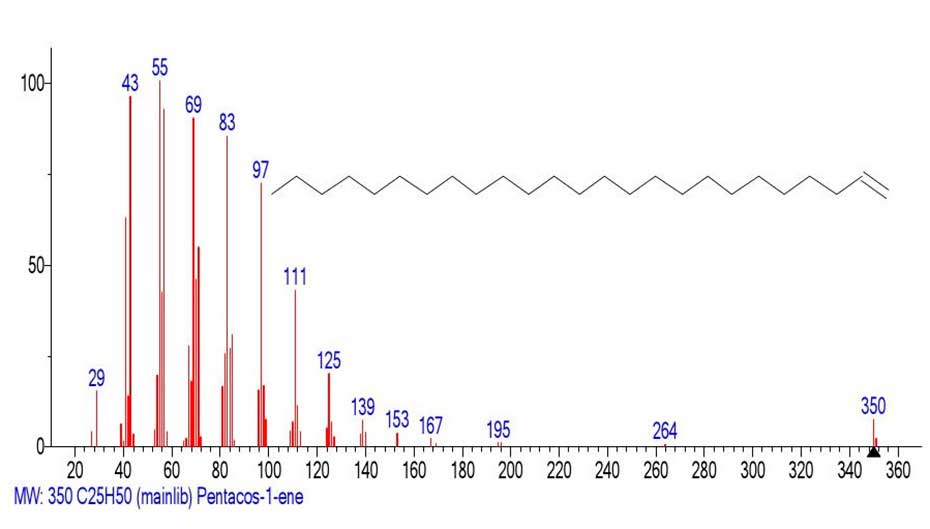
Figure 14. Mass spectrum of pentacos-1-ene С25H50
MW:350 NIST#:412723 ID#: 22772 DB: mainlib
The fragment of the spectrum emulated from the acid mass spectrum (Figure 13) and the known mass spectrum (Figure 14) of pentacos-1-ene differ only in the intensities of the corresponding peaks.
Unlike the two relatively stable acids gentetracontanoic acid С41H82O2 MW:606 (100%) (Figure 6) and hexacontanoic acid C60H120O2 MW: 872(62%) (Figure 9), which retain their carboxyl groups during fragmentation and discard an allyl radical with m/z 321 and respectively an alkyl radical with m/z 631, the unstable nonhexacontanoic acid C69H138O2 MW: 998 (1%) discards acid C44H88O2 648 Da as a cation radical.
That is, the unstable acid C69H138O2 MW: 998 (1%) has a change in fragmentation. In the Nist20 database, there is no acid C44H88O2 648 Da, but there is the d docosyl ester of docosanoic acid.
It is possible that this is how the rearrangement stabilization of this acid occurs. The ratio of the informative part of the spectrum to the molecular weight of the homologue is 1/2.85.
Peakless zones in the spectra of esters of n-carboxylic acid homologs
One example of a peak-free zone in the mass spectra of carboxylic acid esters, which should probably also be considered as an example of disordered homogeneity of the alkyl chain, is the mass spectrum of the docosyl ester of docosanoic acid (Figure 15).
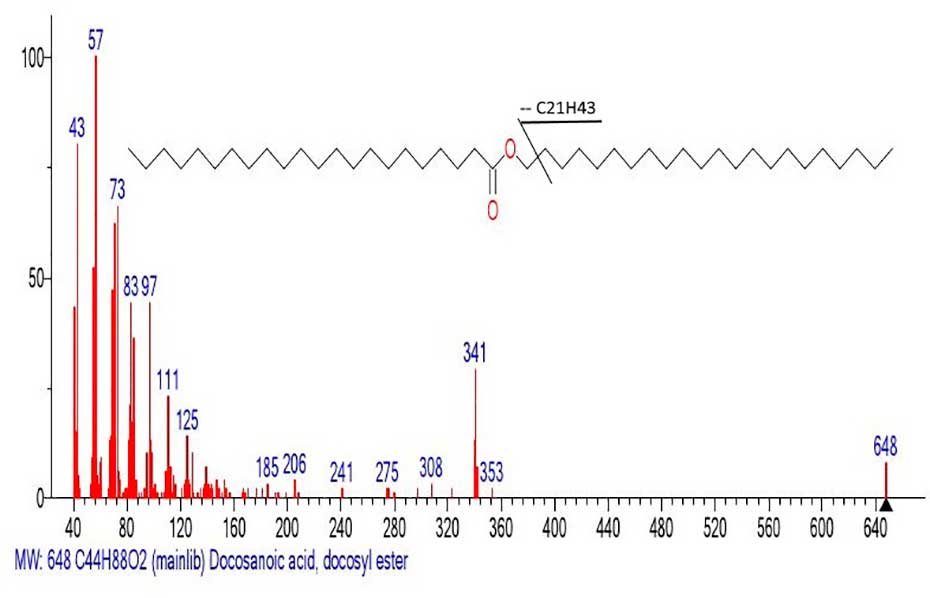
Figure 15. Mass spectrum of the docosyl ester of docosanoic acid MW:648 C44H88O2
NIST#: 72791 ID#: 28082 DB: mainlib.
The first fragment ion of the mass spectrum (Figure 15) c m/z 353 corresponds to the detachment of the .C21H43 radical (648-295=353 Da). Subsequent ejection of the carbon atom leads to the formation of a stable doubly protonated ion (McLafferty rearrangement) with m/z 341 CH3(CH2)20C(=O+H)(OH).
A fragment of the mass spectrum of the acid emulated from the spectrum of the ester (Figure 15) is shown in Figure 16.
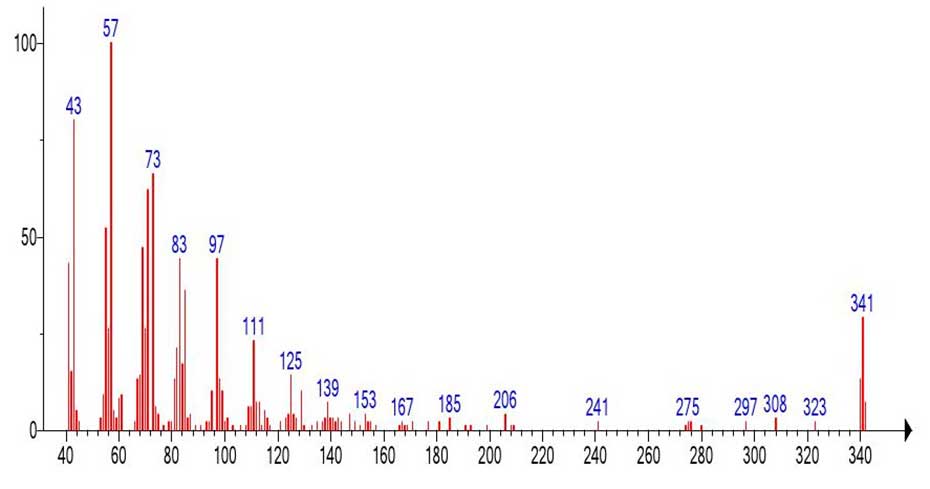
Figure 16. The rearranged, protonated molecular ion of docosanoic acid С22H44O2 MW:340
CH3(CH2)20C(=O+H)(OH) emulated from the mass spectrum of C44H88O2 (Figure 15).
The (Figure 17.) shows the real mass spectrum of docosanoic acid С22H44O2
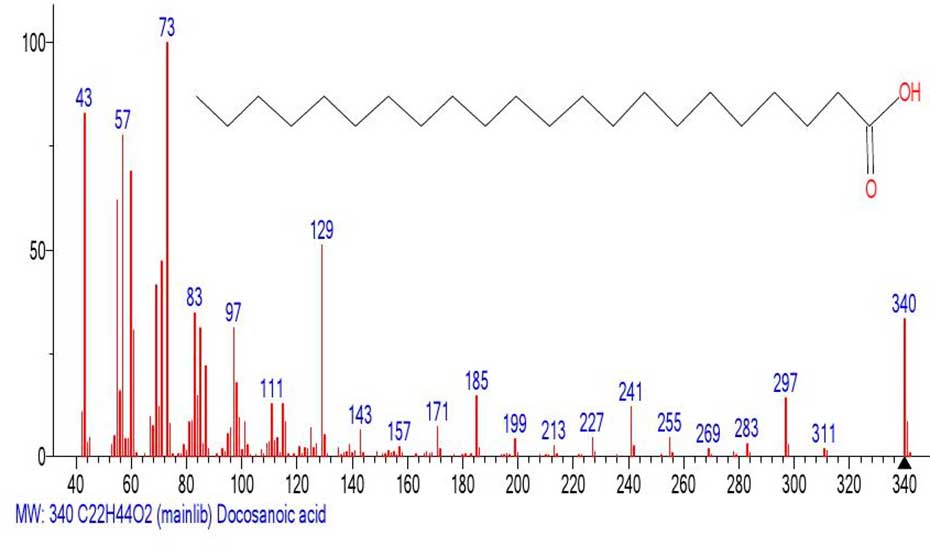
Figure 17. Mass spectrum of docosanoic acid С22H44O2
MW:340 NIST#: 379420 ID#: 47422 DB: mainlib.
In the mass spectrum (Figure 16) emulated from the spectrum of C44H88O2 (Figure 15) there is an intense peak of the ion with m/z 73+CH2CH2COOH (66%) and a rearrangement peak of the ion with m/z 61 CH2=C-O+H2(OH) (6%).
The real mass spectrum of docosanoic acid С22H44O2 shown in Figure 17 is recognizable in the mass spectrum of docosyl ester of docosanoic acid (Figure 15), although the molecular mass of the ester is 1.9 times that of docosanoic acid. In the spectrum (Figure 17), the base peak is the peak with m/z 73, while the intensities of the peaks with m/z 60 and m/z 61 are (69%) and (31%), respectively. The ratio of the informative part of the spectrum to the molecular weight of the homologue is 1/1.9.
The Figure 18 shows the mass spectrum of the methyl ester of hexacontanoic acid.
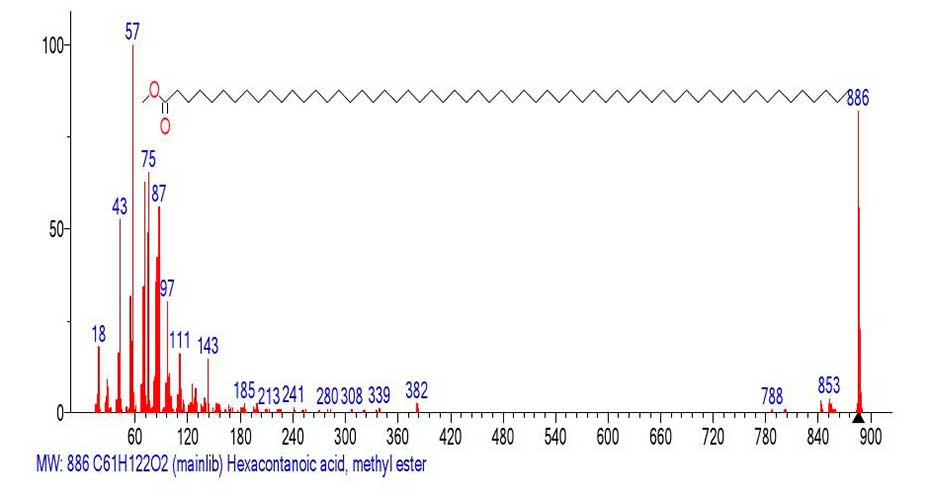
Figure 18. Mass spectrum of hexacontanoic acid methyl ester C61H122O2
MW:886 NIST#: 33419 ID#: 32084 DB: mainlib.
The first fragment ion of the mass spectrum with m/z 855 (-31) corresponds to the detachment of the CH3O. radical. The next fragment ion with m/z 843 corresponds to the detachment (-43) of the CH3CH2.CH2 radical from the opposite terminal group of the molecular ion. The next fragment ion with m/z 788 corresponds to a mass detachment (-98 Da = -7СH2), and the fragment ion with m/z 787 to a detachment of the CH3(CH2)5.CH2 radical. The boundary of the peak-free zone is the fragment ion with m/z 382 +.M 886-382=504, corresponding to the break-off of the olefin molecule -36 СH2, or -18 С2H4. Thus, the mass spectrum of the fragment (Figure 18) with m/z 382 corresponds to the methyl ester CH3OOC(CH2)21CH3 C25H50O2 MW:382. The Figure 19 shows the mass spectrum of the fragment with m/z 382 emulated from the mass spectrum of hexacontanoic acid methyl ester (Figure 18).
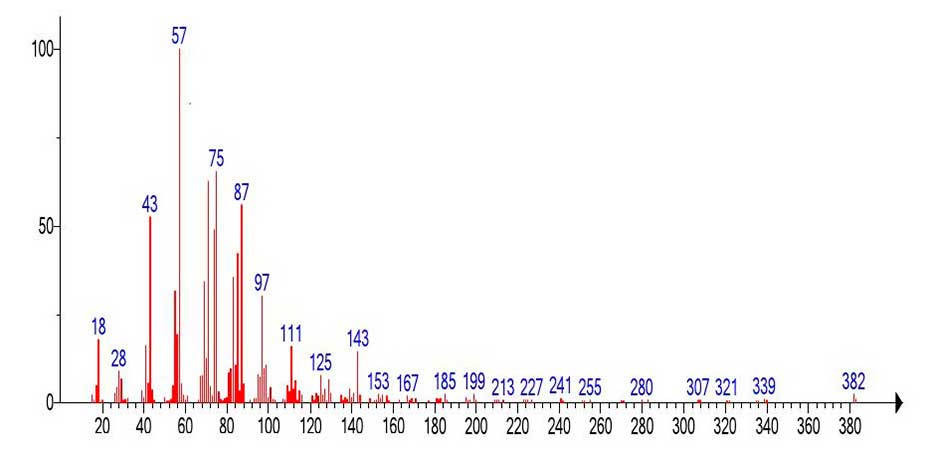
Figure 19. Mass spectrum of the C25H50O2 fragment emulated from the mass spectrum
of C61H122O2 (Figure 18).
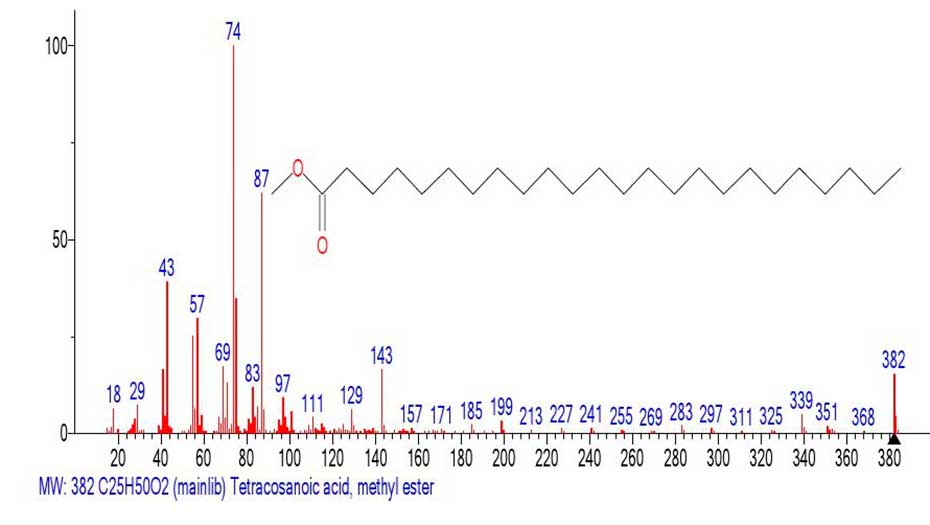
Figure 20. Mass spectrum of the methyl ester of tetracosanoic acid С25H50O2
MW: 382 NIST#: 68657 ID#: 56282 DB: mainlib.
The mass spectrum of the fragment (Figure 19) emulated from the spectrum of С61H122O2 (Figure 18) and the library spectrum (Figure 20) are different, although they have similar fragment ions. The difference between them is that the base peak in the emulated spectrum (Figure 19) is the alkyl ion peak with m/z 57 +С4Н9, whereas in the real mass spectrum of tetracosanoic acid methyl ester (Figure 20) the base peak is the rearrangement protonated peak with m/z 74 СH3O(HO)C=CH2. The intensity of the doubly protonated ion peak with m/z 75 СH3O(H2O+)C=CH2 (Figure 17.) 20 35%. In the spectrum of the fragment Figure 19, the intensities of the peaks with m/z 75(65%) and 74(49%) are also quite high. The ratio of the informative part of the spectrum to the molecular weight of the homologue is 1/2.32.
The mass spectrum of the methyl ester of nonahexacontanoic acid C70H140O2 MW: 1012 is shown in Figure 21.
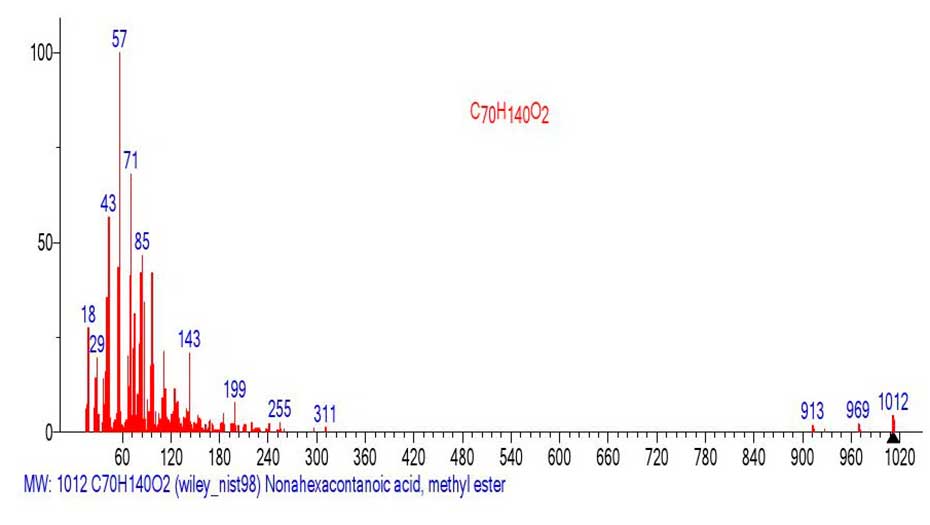
Figure 21. Mass spectrum of the methyl ester of nonahexacontanoic acid C70H140O2
MW: 1012 ID#: 391535 DB: wiley_ nist98.
In contrast to the mass spectrum of the methyl ester of hexacontanoic acid С61H122O2 (Figure 18) with the basic peak of molecular cation radical (m/z 886), in the spectrum of methyl ester of nonahexacontanoic acid (Figure 21) С70H140O2 the intensity of peak c m/z 1012 of molecular ion is only 4.1%. The first fragment peak of the mass spectrum is the peak with m/z 969 (M-43) corresponding to the detachment of the CH3CH2 .CH2 radical from the alkyl terminal group. The second fragment peak with m/z 913,969-913=56 (-С2H4) corresponds to the detachment of the ethylene molecule. The peak-free zone of the mass spectrum between the peak with m/z 969 and the peak with m/z 311 is 658 Da, or 47 CH2 groups. The (Figure 22) shows the mass spectrum of the fragment with m/z 311 emulated from the mass spectrum of nonahexacontanoic acid methyl ester (Figure 21).
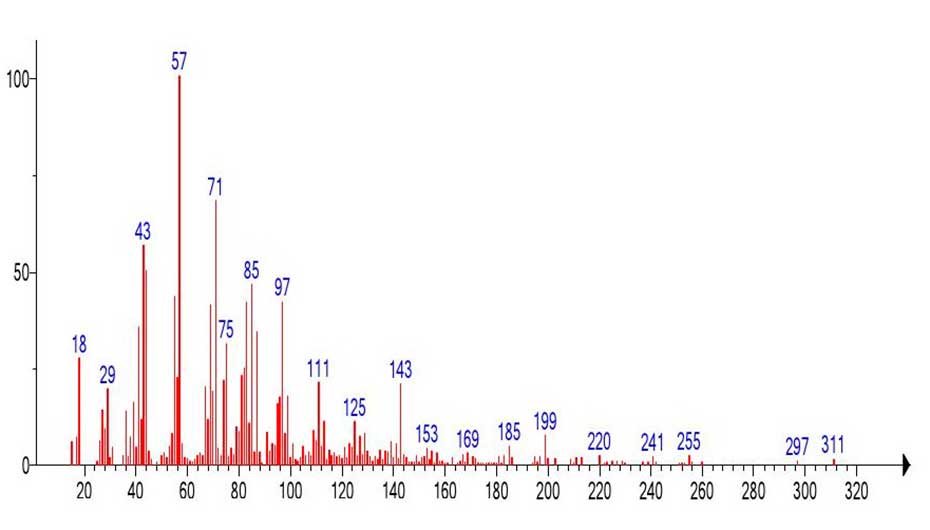
Figure 22. Mass spectrum of the fragment c m/z 311 emulated from the mass spectrum of nonhexacontanoic acid C70H140O2 (Figure 21).
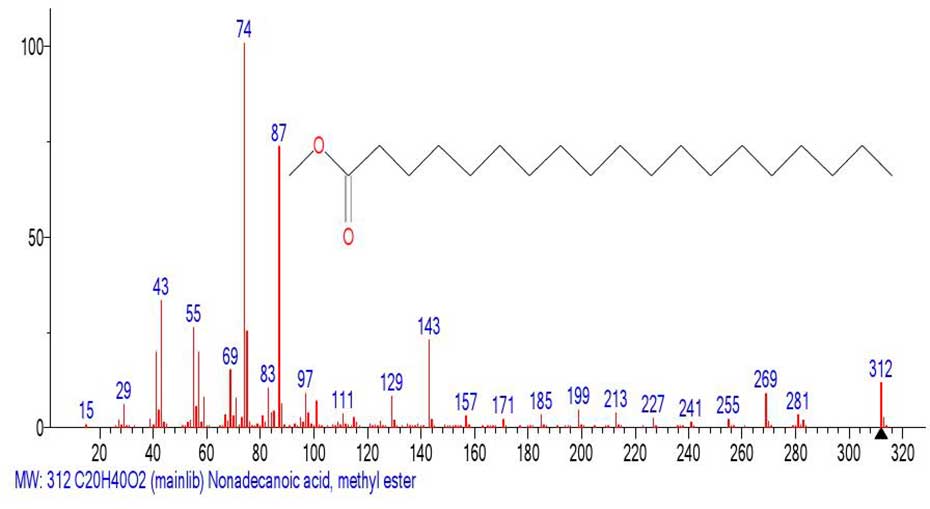
Figure 23. Mass spectrum of the methyl ester of nonadecanoic acid C20H40O2
MW: 312 NIST#: 352589 ID#: 56264 DB: mainlib.
The mass spectrum of the fragment (Figure 22) emulated from the spectrum of С61H122O2 (Figure 21) and the library spectrum (Figure 23) are different and have minimal similarity. The ratio of the informative part of the spectrum to the molecular weight of the homologue is 1/3,24.
The Figure 24 shows the mass spectrum of the propyl ester of nonahexacontanoic acid C72H144O2 MW: 1040.
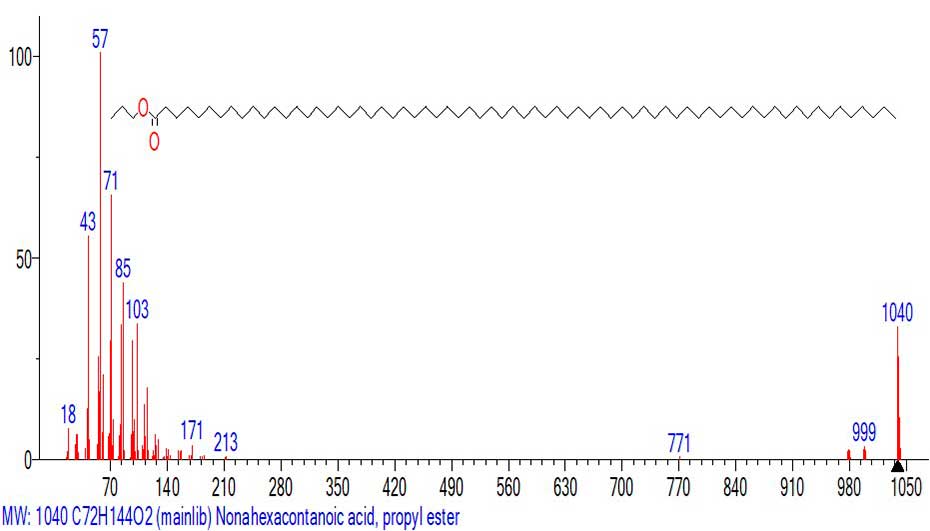
Figure 24. Mass spectrum of the propyl ester of nonahexacontanoic acid C72H144O2
MW:1040 NIST#: 33424 ID#: 29089 DB: mainlib.
The first detachment M 1040-998=42 corresponds to the detachment of the C3H6 molecule, probably from the ester propyl group to form a molecular acid ion with m/z 998 C69H138O2. The following detachment of 998-980=18 corresponds to the detachment of a water molecule to form the terminal terminal group O=C=CH- with MW=980. The subsequent release of a hydrogen atom stabilizes the terminal group O=C=CH=CH- with m/z 979. A weak peak with m/z 771 is formed probably in another series of ions upon detachment of the ester group (-C3H7OCOC13H26) from the molecular ion of the C17H33O2 radical to form an ion with m/z 771 +(CH2)54CH3. The detachment of 1040-827 (-29С2H4)CH3=213 is completed by the formation of the ion with m/z 213 С3H7OC(=O)(CH2)8+CH2.
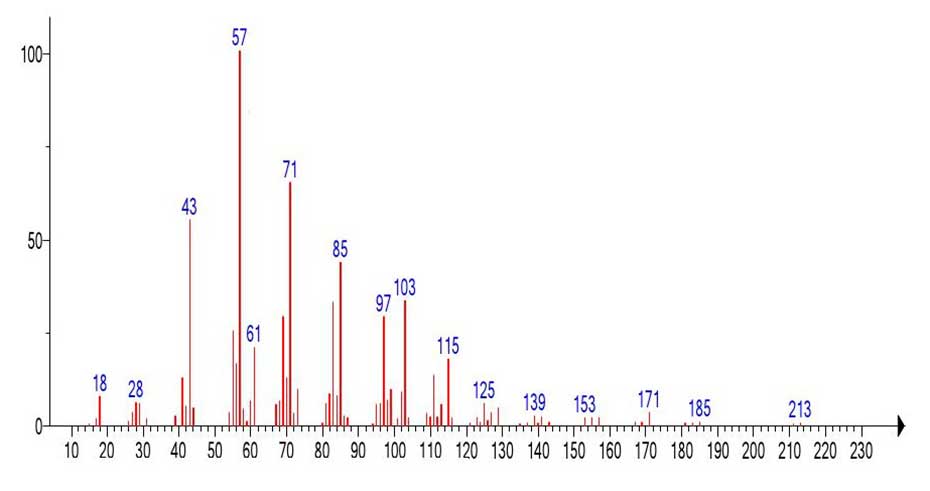
Figure 25. Mass spectrum fragment of the propyl ester of decanoic acid emulated from the mass spectrum of (Figure 24).
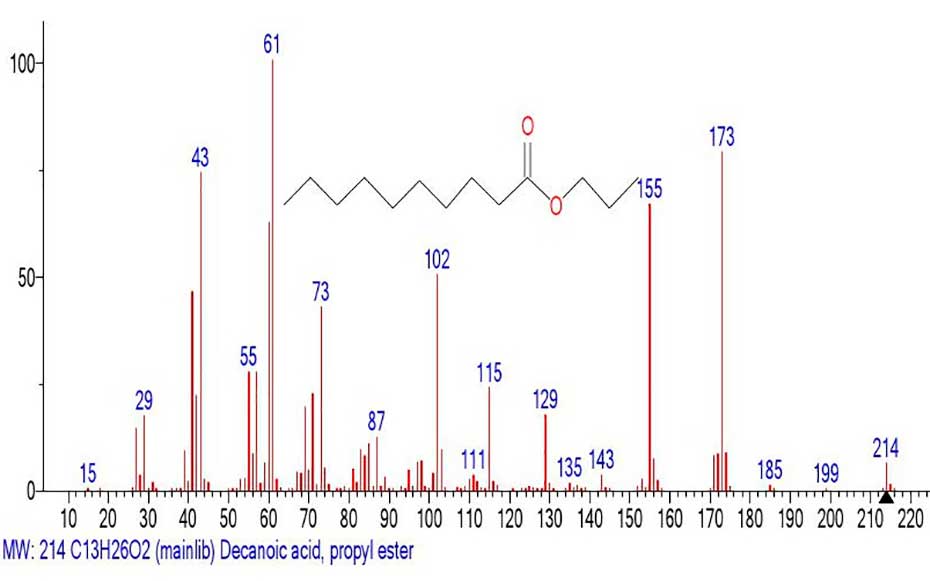
Figure 26. Mass spectrum of the propyl ester of decanoic acid
MW: 214 NIST#: 229582 ID#: 36409 DB: mainlib.
The mass spectrum of the propyl ester of decanoic acid (Figure 26) and the mass spectrum of the fragment emulated from the spectrum of the propyl ester of nonahexacontanoic acid (Figure 25) are different, although the fragment of the spectrum (Figure 25) still retains traces of the presence of a carboxyl group.
Apparently, it is as a result of too large ejected mass and a very large peak-free zone 1040-214=826 Da that the mass spectrum fragment with m/z 213 retains traces of the presence of the carboxyl group. The ratio of the informative part of the spectrum to the molecular weight of the homologue is 1/4.86.
Conclusion
Because of the large peak-free zones in the spectra of higher linear carboxylic acids and their esters, it is impossible to visualize the process of their fragmentation by two pairs of opposite ionic series occurring in the spectra of lower homologues, as was done in the spectrum of pentadecanoic acid C15H30O2 MW:242.
The fragmentation of higher homologs can be represented by two “opposite” ion series starting from different terminal groups. The peak-free zone of the spectrum results from two series of fragmentation +.M. The first series is the spectrum of a molecular ion with several fragment ions of carboxyl group decomposition, in particular with water detachment. The second series is the spectrum without the molecular ion. This is the spectrum of a small, final fragment of the molecule that retains weak peaks confirming the evidence of an acid or ester.
It is likely that it is due to the peak-free zone, which arises by breaking off a significant part of the chain together with the molecular ion without fragmentation, that the excitation energy for the remaining chain fragment is “saved” or conserved. An alternative fragmentation scheme with two synchronous chain breaks and emission of the entire central zone of the spectrum seems unlikely.
With increasing molecular weight of the homologue, the difference between the spectrum of the fragment emulated from the mass spectrum of the acid or its ester and the known mass spectrum of the acid (or its ester) increases.
However, it is precisely due to the increase in the ejected chain mass and the very large peak-free zone that the final fragment of the spectrum, as a rule, still retains traces of the presence of the carboxyl group in it.
Acknowledgements
The work was supported by the Ministry of Science and Higher Education of the Russian Federation, using the scientific equipment of the Center for the Study of Molecular Structures of INEOS RAS.
References
- McLafferty, Fred W., Anal.Chem., 1959, 31, 82.
- Kagramanov N.D., A new perspective on the McLafferty rearrangement in the spectra of n-carboxylic acids and their methyl and 2,2,2-trifluoroethyl esters, Fluorine notes, 2020, 5(132), 3-4.
ARTICLE INFO
Received 28 March 2025
Accepted 22 April 2025
Available online June 2025
Recommended for publication by PhD M.A. Manaenkova
eLIBRARY Document Number (EDN) YVONIV

Fluorine Notes, 2025, 160, 1-2