Received: December 2022
DOI 10.17677/fn20714807.2023.01.02
Fluorine Notes, 2023, 146, 3-4
SYNTHESIS OF β-NAYF4/YB+3/ER+3 FLUORIDE MICROCRYSTALS WITH IN SITU CONTROL OF PHOTOLUMINESCENCE IN UP- AND DOWN-CONVERSIONS
V.I. Sokolov, E.N. Glazunova, I.O. Goryachuk, S.I. Molchanova
1Federal Scientific Research Center "Crystallography and Photonics" RAS, 119333, Leninsky ave. 59, Moscow, Russia
Abstract: Fluoride microcrystals NaYF4/Yb+3/Er+3, which are in hexagonal β-phase, have been synthesized. The transition of α-nanoparticles in a solution of oleic acid and 1-octadecene to the β-phase was monitored directly during synthesis process by changing the photoluminescence spectra of Er+3 ions in up- and down-conversions upon pumping with laser radiation at a wavelength of 980 nm. The resulting crystals, embedded into polymer matrix, can be used to create compact waveguide light amplifiers and lasers operating in the telecommunications C-wavelength range of 1530-1565 nm.
Keywords: fluoride microcrystals, rare earth elements, photoluminescence, up- and down-conversion.
Introduction
Fluoride nano- and microcrystals NaYF4, NaLuF4, etc., doped with rare-earth elements Yb, Er, Tm, Ce [1-4], are widely used both in biomedicine (see [5, 6] and references in these papers) and in technology, for example, to create three-dimensional displays [7], high-efficiency solar cells [8], upconverting lasers in visible range [9], and so in compact waveguide light amplifiers [10–13]. NaYF4 fluoride crystals can exist in the form of cubic crystal lattice (so-called α-phase), or in the form of hexagonal lattice (β-phase). The photoluminescence (PL) spectra of rare earth ions in NaYF4 crystal differ significantly in the case of cubic or hexagonal phase [1-5, 14]. Thus, the up-conversion efficiency (i. e. conversion of IR pump radiation into visible radiation) in β-NaYF4/Yb+3/Er+3 crystals is more than an order of magnitude higher than that in α-NaYF4/Yb+3/Er+3 nanocrystals [2]. On the other hand, the increase in PL intensity of erbium-doped α-NaYF4/Yb+3/Er+3 crystals in down-conversion (i. e. within “telecommunication” wavelength range near 1550 nm) is important for creating waveguide amplifiers and single-frequency lasers with distributed feedback operating in this range. Such devices are a single-mode waveguide made from polymer material with NaYF4/Yb+3/Er+3 nano- or microcrystals embedded in it. Because of this, the development of reliable methods for synthesis of such crystals with high down-conversion coefficient within near-IR region of spectrum is of great importance.
This paper reports on the synthesis of β-NaYF4/Yb+3/Er+3 fluoride microcrystals in solution of oleic acid and 1-octadecene with in situ monitoring of their PL spectra excited by laser radiation with a wavelength of 980 nm, both in up- and down-conversion. In previous papers, the synthesis of crystals was controlled only by measuring their PL spectra in visible wavelength range [15]. Synthesis of β-NaYF4/Yb+3/Er+3 microparticles with simultaneous control of their photoluminescence in up- and down-conversion was performed by authors for the first time. Such control makes it possible to optimize the synthesis time in order to obtain the maximum quantum yield of PL particles within telecommunication region of spectrum near 1550 nm.
1. Experimental section. Synthesis of fluoride microcrystals NaYF4/Yb+3/Er+3
To obtain NaYF4/Yb+3/Er+3 fluoride microcrystals, the commercial reagents were used: yttrium, ytterbium, erbium oxides, sodium carbonate, oleic acid 90%, 1-octadecene 90% (Sigma-Aldrich) and trifluoroacetic acid 99% (PanReac). Oxides and sodium carbonate were used without pretreatment. Trifluoroacetic acid was purified by distillation and diluted with distilled water to 50% vol.
Before experiment, the mixture of Na, Y, Yb, and Er trifluoroacetates (TFA) with element ratio (Na:Y:Yb:Er = 1.60:0.78:0.20:0.02) was prepared by dissolving a portion of corresponding oxides and soda in dilute trifluoroacetic acid at boiling. The crystals were synthesized at atmospheric pressure by thermal decomposition of TFA in oxygen-free medium in a mixture of oleic acid and 1-octadecene [1, 2, 15]. To do this, 1.3 g of mixture of trifluoroacetates was placed in a 100 ml four-necked flask equipped with thermometer, argon supply system and vacuum cock; 20 ml of oleic acid and 20 ml of 1-octadecene were added. The flask, with active stirring by magnetic stirrer, was connected to a vacuum pump, and temperature of reaction mixture was raised to 110°C by immersing the flask into Rose alloy in order to remove dissolved oxygen and water molecules from suspension. The pressure in the system was gradually reduced to 7 mbar, making sure that there was no violent foaming. After foaming ceased, the solution was kept under vacuum for 60 min. The flask was then filled with argon.
By continuing purging with argon, the temperature of Rose alloy was increased to 340°C at a rate of 15 deg/min. When the temperature of reaction mixture reached 240-250°C, the trifluoroacetates began to decompose [1, 2], which led to formation of nucleation breathe, and crystals begin to grow. The reaction was carried out at a mixture temperature of 320°C for 165 min, controlling the crystal growth process by changing the integrated intensity Iint_PL and IPL spectra both in up-conversion (within spectral range of 450-750 nm) and in down-conversion (within spectral range of 1250-1680 nm). The photoluminescence of particles in solution was excited using a fiber optic probe under the action of diode laser radiation with a wavelength of 980 nm. The probe contained a pump fiber and two receiving fibers, which captured the PL signal from particles in the flask and directed it to photodetectors. To detect PL within visible region of spectrum, the minispectrometer FSD-8 (400-800 nm, Research and Development Center for Fiber Optic Devices, Russia) was used, and within near IR range - InGaAs minispectrometer ATP8000 (900-1680 nm, Optosky, China) was used. The installation layout for PL monitoring of particles at up- and down-conversion is shown in Fig. 1.
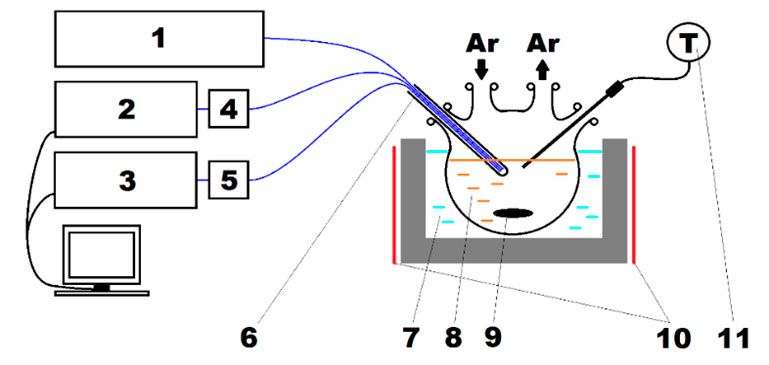
Figure 1. Installation layout for PL observing of NaYF4/Yb+3/Er+3 particles during their synthesis. 1 - PL-excitation laser with a wavelength of 980 nm; 2, 3 - ETL- and IR-minispectrometers, respectively; 4, 5 - Interference filters, cutting off the excitation radiation; 6 - Fiber optic probe;7 - Bath with Rose alloy; 8 - Reaction mixture in four-necked flask; 9 - Magnet for mixing the mixture; 10 - Heater; 11 - Thermometer.
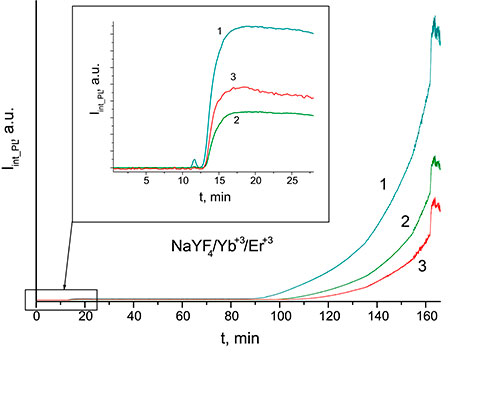
In Fig. 2 shows the dependences of integrated PL intensity IInt_PL of NaYF4/Yb+3/Er+3 crystals on the synthesis time t and their up-conversion PL spectra IPL near 521, 539 and 653 nm at different times. Characteristic PL peaks in Fig. 2b are due to energy structure of Er3+ rare-earth ions in NaYF4 crystal, specifically – due to 2H11/2→ 4I15/2, 4S3/2→ 4I15/2 и 4F9/2 → 4I15/2 transitions (see inset in Fig. 2b [14]). As can be seen from Fig. 2a, the change in integrated intensity of all three PL bands during up-conversion occurs in two stages. The first increase in PL begins approximately from 10th min, and by 15th min PL intensity reaches a stationary value, which does not change until about 90th min. Starting from this moment, PL intensity in up-conversion again begins to increase, reaches its maximum value by 160th min, and then does not change. We believe that these two stages are associated with formation of NaYF4/Yb+3/Er+3 particles in α- and β-phases, respectively. A more detailed consideration of this process will be performed in our further studies.
|
|
 2a)
2a)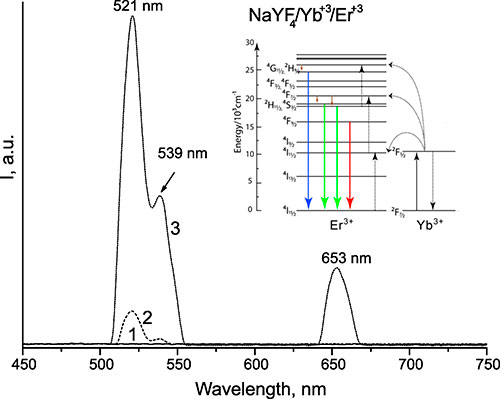 2b)
2b)Figure 2. (a) Dependence of up-conversion integrated PL intensity IInt_PL of NaYF4/Yb+3/Er+3 crystals (within wavelength ranges 521±12 (1), 539±12 (2) and 653±30 nm (3)) on time t during the synthesis. (b) PL spectra of IPL particles in a 3 min (1), 85 min (2) and 125 min (3) after start of synthesis process. The inset shows a simplified system of energy levels for ytterbium and erbium. Bold arrows pointing down show the radiative transitions in up-conversion.
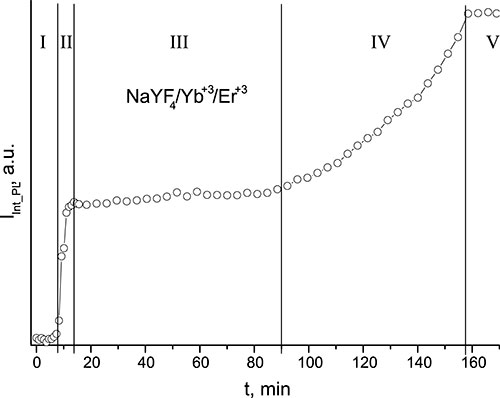
In Fig. 3a shows the dependence of integrated PL intensity IInt_PL and IInt_PL of NaYF4/Yb+3/Er+3 particles in down-conversion on synthesis time t. This dependence can be conditionally divided into five stages. At the stage I, during the first 8 min after start of process there is no PL intensity in down-conversion. Starting from 8 min, PL intensity sharply increases (stage II), which is associated with onset of particle formation. Since the 15th min, PL intensity reaches a stationary value and then does not change until about 90th min (stage III). Starting from this moment, the increase in PL intensity in down-conversion (stage IV) is again observed, which reaches a stationary value by 160th min and then does not change. In Fig. 3b shows PL spectra of NaYF4/Yb+3/Er+3 particles at different times t. The characteristic double PL peak with 73 nm wide and centers near 1527 and 1545 nm (see Fig. 3b) is due to 4I13/2→4I15/2 transition in Er3+ ions [14].
|
|
 3a)
3a)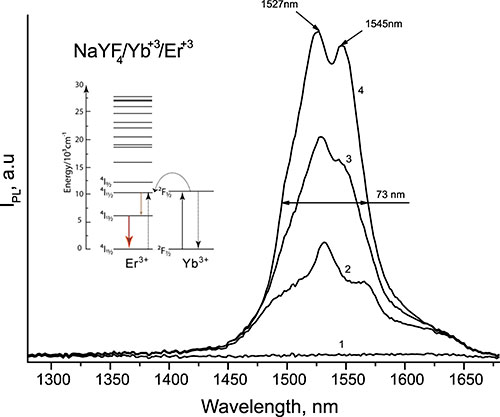 3b)
3b)Figure 3. (a) Dependence of integrated PL intensity IInt_PL of NaYF4/Yb+3/Er+3 crystals in down-conversion (within wavelength range 1530±150 nm) on time t during synthesis. (b) PL spectra of IPL particles in a 7 min (1), 15 min (2), 136 min (3) and 159 min (4) after start of particle synthesis. The inset shows a simplified system of energy levels for ytterbium and erbium. The bold arrow pointing down shows the radiative transition in down-conversion.
After completion of synthesis reaction, the flask with reaction mixture was removed from Rose alloy bath and cooled to room temperature. At the same time, PL intensity both in up- and down-conversions increased. Note that a decrease in temperature of NaYF4/Yb+3/Er+3 crystals was accompanied by a change in intensity ratio of PL lines with centers near 521 and 540 nm (see Fig. 4).
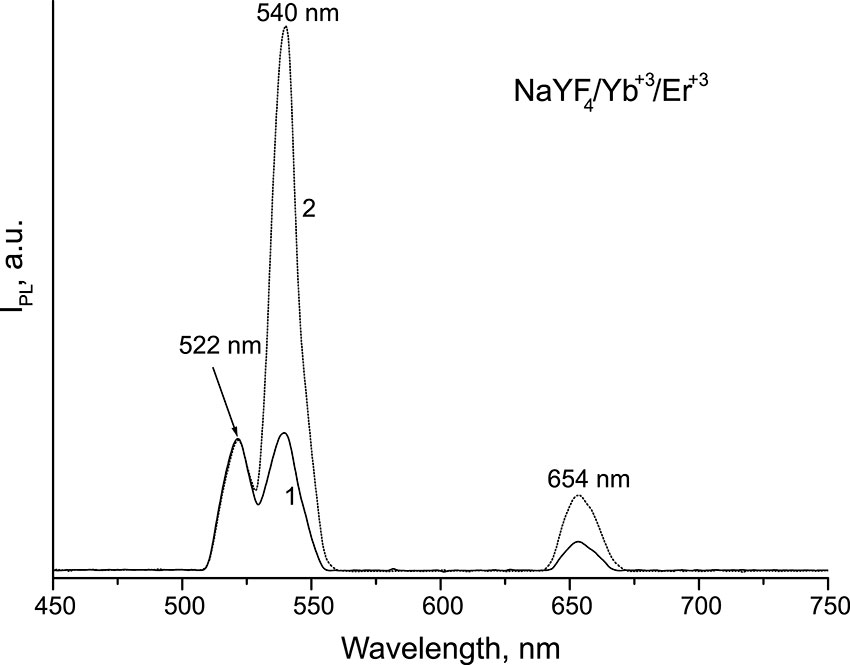
Figure 4. PL spectra of NaYF4/Yb+3/Er+3crystals after completion of synthesis at a temperature of reaction mixture of 155°С (1) and 30°С (2).
After cooling to room temperature, the solution was poured into 50 ml plastic vials in 20 ml portions and diluted to 50 ml with isopropanol. The precipitate was centrifuged for 20 min at 7000 rpm, after which the solution was decanted. 10 ml of hexane were added and after dissolution all fractions were collected in one vial, diluted with isopropanol to 50 ml and centrifuged again. The process of washing and centrifugation was repeated several times.
2. Study of crystal structure and particle sizes
Structural diagnostics of synthesized crystals was carried out via Rigaku Miniflex600 X-ray diffractometer (Cu, λ= 1.54184 Å) within the range of incidence angles 2θ= 10-70 deg. X-ray diffraction pattern of NaYF4/Yb+3/Er+3 powder is shown in Fig. 5. It follows from analysis of this diffraction pattern that obtained particles are mainly in β-phase.
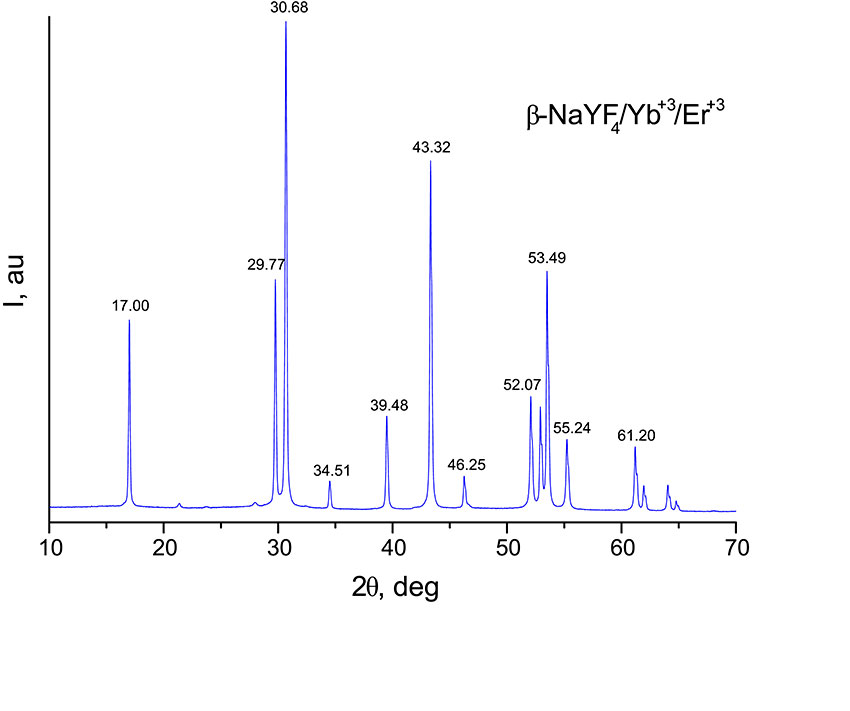
Figure 5. The powder diffraction pattern of β-NaYF4/Yb+3/Er+3 particles obtained via Rigaku Miniflex600 X-ray diffractometer. is the angle of incidence of X-ray beam to the sample.
3. Particle size measurement of β-NaYF4/Yb+3/Er+3
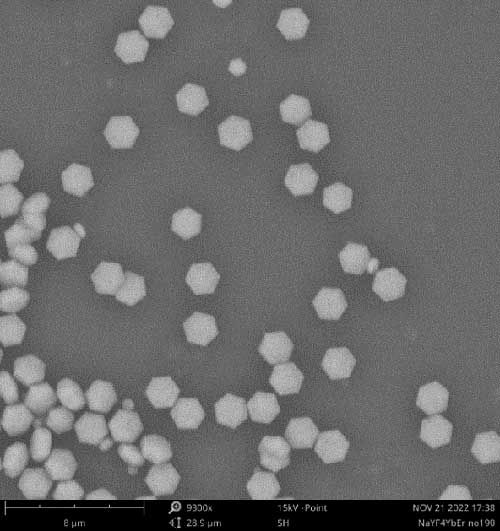
The average diameter <D> of synthesized β-NaYF4/Yb+3/Er+3 particles was measured by methods of electron and UV optical microscopy. In Fig. 6 shows photographs of particles obtained via Phenom ProX scanning electron microscope (Thermo Fisher Scientific). It can be seen that these particles have a hexagonal shape, which corresponds to crystalline -phase. The average diameter of β-NaYF4/Yb+3/Er+3crystals (as follows from Fig. 6) lies within 1–2 µm.
|
|
 6a)
6a)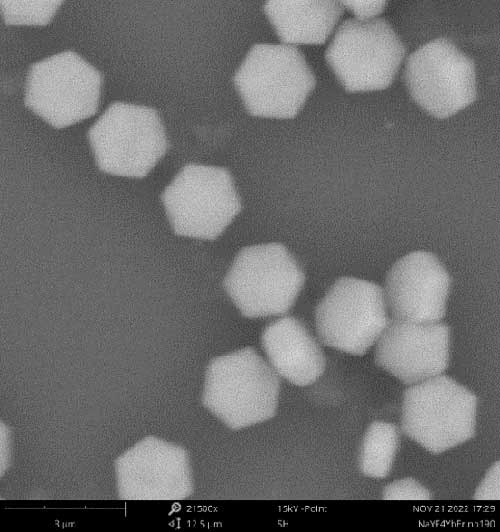 6b)
6b)Figure 6. Photographs of β-NaYF4/Yb+3/Er+3microcrystals obtained by Phenom ProX scanning electron microscope at a magnification of 9300x (a) and 21500x (b).
The shape and size of particles with diameter of order of one micron can also be determined by optical UV microscopy. Indeed, the resolution R of optical microscope is determined by following formula:
R = 0,61λ/NА, (1)
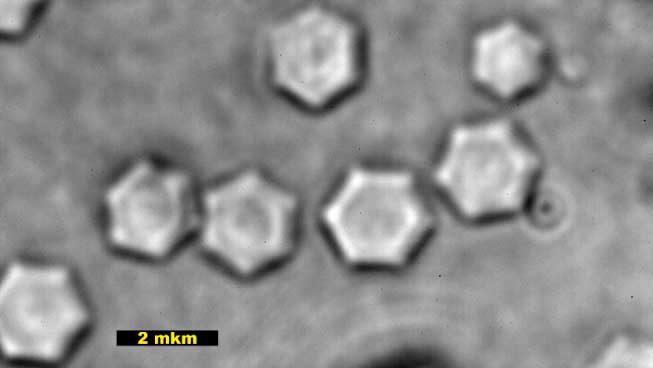
where λ is wavelength of light that forms the image of particles, NA is numerical aperture of objective. When using the immersion optical objective with NA = 1.40, the resolution at a wavelength of λ= 405 nm, according to formula (1), is R = 0.176 µm, which is 6-11 times less than average particle diameter <D> = 1-2 µm (see Fig. 6). In Fig. 7 shows optical photographs of synthesized β-NaYF4/Yb+3/Er+3 microparticles obtained via Neophot-32 microscope equipped with 100x/1.40 objective and SCM2020-UV-TR digital UV camera (EHD imaging GmbH, 2048 × 2048 pixels, size pixels 6.5 × 6.5 µm). As follows from analysis of Fig. 7a, these particles have a hexagonal shape and diameter of 1-2 μm, which corresponds to results obtained via Phenom ProX electron microscope.
|
|
 7a)
7a)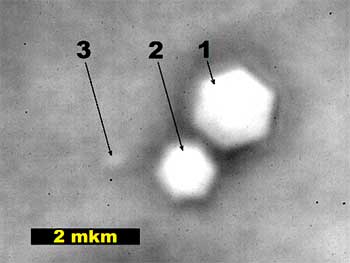 7b)
7b)Figure 7. Photographs of β-NaYF4/Yb+3/Er+3, fluoride crystals obtained by Neophot-32 optical microscope at a wavelength of 405 nm with 100х/1,40 immersion objective.
Note that in Fig. 7b smaller particles are also observed. Thus, crystal No. 1 has a diameter of 1.35 µm, and crystal No. 2 has a diameter of 0.95 µm. The hexagonal shape of these crystals is clearly distinguishable. Even smaller particle No. 3 in Fig. 7b has a diameter of ≈0.2 μm. The shape of this particle cannot be distinguished when using a wavelength of 405 nm and 100x/1.40 objective.
3. Results and discussions
Synthesis of fluoride nano- and microcrystals NaYF4/Yb+3/Er+3 with predetermined crystal structure and diameters is of great importance for medicine and technology. For the first time, we have synthesized β-NaYF4/Yb+3/Er+3 microcrystals with simultaneous control of their PL intensities both at up- and down-conversions. Such control makes it possible to more accurately determine the moment in time at which this synthesis should be stopped in order to obtain crystals with optimal PL intensity within required spectral range. It has been established that synthesis of microcrystals takes place in two stages. At the first stage, which lasts 7-8 min, there is no FL intensity, then PL intensity sharply increases (stage II) and reaches a stationary value, which does not change during 70-80 min (stage III). This is followed by a second increase in PL intensity (stage IV) and reach a stationary value (stage V). The increase in PL intensity in two stages may be due to formation of NaYF4/Yb+3/Er+3 particles in α- and β-phases, respectively.
The synthesized microcrystals can be used to create various active devices of integrated optics, for example, waveguide amplifiers and lasers operating within telecommunications C-wavelength range of 1530-1565 nm. Such devices are a single-mode polymeric waveguide with light-guiding core diameter of 6-8 µm, into which β-NaYF4/Yb+3/Er+3 particles are embedded. To do this, the particle size should be 4 - 8 times smaller than core diameter. Microcrystals with average diameter <D> = 1-2 µm satisfy this requirement.
Consider the question of what is the minimum size of crystal whose shape can be resolved using optical microscopy. It follows from formula (1) that resolution of objective R improves with increase in its numerical aperture and with decrease in λ wavelength of illuminating radiation. Assuming λ=248 nm (the intense spectral line of mercury-xenium lamp) and NA = 1.50 (the newest 100x/1.50 objectives manufactured by Olympus have such numerical aperture) using formula (1) we find R = 0.101 μm, which is 1.74 times less than R = 0.176 µm for our objective. Since with 100x/1.40 immersion objective it is possible to distinguish the hexagonal shape of particles with a diameter of 0.95 µm and register the presence of particles with a diameter of 0.2 µm (see Fig. 7b, c), it can be assumed that using 100x/1.50 objective it will be possible to resolve the shape of particles with a diameter of 0.5 µm and establish the presence of particles with a size of 0.1 µm.
Conclusion
For the first time, β-NaYF4/Yb+3/Er+3 microcrystals were synthesized with the control of their photoluminescence simultaneously in up- and down-conversion. Synthesis of particles occurs in several stages and is accompanied by increasing in their PL intensity, excited by laser radiation with a wavelength of 980 nm, within visible and near-IR spectral ranges. The resulting microcrystals are promising for creation of waveguide amplifiers and lasers operating within telecommunications C-wavelength range 1530-1565 nm.
Acknowledgements
This work was financially supported by the Ministry of Science and Higher Education of the Russian Federation within the framework of the state task of the Federal Research Center «Crystallography and Photonics» of the Russian Academy of Sciences (synthesis of fluoride crystals doped with rare-earth elements) and RFBR grant No 20-07-01038 (investigation of PL of crystals in up- and downconversion). The equipment of the Center for Collective Use of the FRC «Crystallography and Photonics» of the Russian Academy of Sciences was used in the work.
References
- H.-X. Mai, Y.-W. Zhang, R. Si, Z.-G. Yan, L.-D. Sun, L.-P. You, Ch.-H. Yan, High-Quality Sodium Rare-Earth Fluoride Nanocrystals: Controlled Synthesis and Optical Properties, J. Am. Chem. Soc., 2006, 128(19), 6426.
- H.-X. Mai, Y.-W. Zhang, L.-D. Sun, C.-H. Yan, Size- and phase-controlled synthesis of monodisperse NaYF4:Yb,Er nanocrystals from a unique delayed nucleation pathway monitored with upconversion spectroscopy, J. Phys. Chem. C., 2007, 111, 13730.
- X. Ye, J.E. Collins, Y. Kang, J. Chen, D.T.N. Chen, A.G. Yodh, C.B. Murray, Morphologically controlled synthesis of colloidal upconversion nanophosphors and their shape-directed self-assembly, Proc. Nat. Acad. Sci. USA, 2010, 107(52), 22430.
- X. Liu, X. Zhang, G. Tian, W. Yin, L. Yan, L. Ruan, Z. Yang, D. Xiao, Z. Gu, A simple and efficient synthetic route for preparation of NaYF4 upconversion nanoparticles by thermo-decomposition of rare-earth oleates, CrystEngComm., 2014, 16, 5650.
- S. Alyatkin, I. Asharchuk, K. Khaydukov, A. Nechaev, O. Lebedev, Y. Vainer, V. Semchishen, E. Khaydukov, The influence of energy migration on luminescence kinetics parameters in upconversion nanoparticles, Nanotechnology, 2017, 28, 035401.
- E.L. Guryev, N.O. Volodina, N.Y. Shilyagina, S.V. Gudkov, I.V. Balalaeva, A.V. Volovetskiy, A.V. Lyubeshkin, A.V. Sen, Ermilov S.A., V.A. Vodeneev, R.V. Petrov, A.V. Zvyagin, Z.I. Alferov, S.M. Deyev, Radioactive (90Y) upconversion nanoparticles conjugated with recombinant targeted toxin for synergistic nanotheranostics of cancer, Proc. Nat. Acad. Sci. USA, 2018, 115(39), 9690.
- A. Rapaport, J. Milliez, M. Bass, A. Cassanho, H. Jenssen, Review of the properties of up‑conversion phosphors for new emissive displays, Journal of display technology, 2006, 2(1), 68.
- H.A. Hoeppe, Recent developments in the field of inorganic phosphors, Angew. Chem., Int. Ed., 2009, 48, 3572.
- H. Zhu, X. Chen, L.M. Jin, Q.J. Wang, F. Wang, S.F. Yu, Amplified spontaneous emission and lasing from lanthanide-doped up-conversion nanocrystals, ACSNano, 2013, 7(12), 11420.
- X. Zhai, J. Li, Sh. Liu, X. Liu, D. Zhao, F. Wang, D. Zhang, G. Qin, W. Qin, Enhancement of 1.53 μm emission band in NaYF4:Er3+,Yb3+,Ce3+ nanocrystals for polymer-based optical waveguide amplifiers, Optical Materials Express, 2013, 3(2), 270.
- Y. Wang, X. Guo, Sh. Liu, K. Zheng, G. Qin, W. Qin, Controllable synthesis of ‑NaLuF4:Yb3+,Er3+ nanocrystals and their application in polymer-based optical waveguide amplifiers, Journal of Fluorine Chemistry, 2015, 175, 125.
- G.F.R. Chen, X. Zhao, Y. Sun, Ch. He, M.Ch. Tan, D.T.H. Tan, Low loss nanostructured polymers for chip-scale waveguide amplifiers, Scientific Reports, 2017, 7, 3366.
- X. Liu, M. Zhang, G. Hu, Gain Enhancement of the Optical Waveguide Amplifier Based on NaYF4/NaLuF4: Yb, Er NPs-PMMA Integrated with a Si3N4 Slot, Nanomaterials, 2022, 12, 2937.
- N.V. Znamensky, Yu.V. Malyukin, Spectra and dynamics of optical transitions of rare-earth ions in crystals, Moscow. Fizmatlit, 2008. In Russian.
- V.I. Sokolov, I.M. Asharchuk, E.N. Glazunova, I.O. Goryachuk, A.V. Lyubeshkin, Synthesis of β-NaYF4/Yb+3/Er+3 fluoride nanocrystals at high pressure, Fluorine Notes, 2021, 1(134), 1-2.
ARTICLE INFO
Received 02 December 2022
Accepted 15 December 2022
Available online February 2023
Recommended for publication by PhD M.A. Manaenkova
eLIBRARY Document Number (EDN) VRRAYV

Fluorine Notes, 2023, 146, 3-4