Received: December, 2014
DOI 10.17677/fn20714807.2015.01.03
Fluorine Notes, 2015, 98, 7-8
Analytical Control of Products of the Synthesis of Perfluoropolyethers
P.A.Khrustalev1, E.L.Belyaev1, O.V.Cheremisina2, S.Z.El’-Salim3
State Research Institute of Organic Chemistry & Technology
23, Shosse Entuziastov, 111024
Moscow, Russian Federation
e-mail: dir@gosniiokht.ru
2National Mineral Resources University, 2, Line 21, Vasilievsky Ostrov, 199106 St. Petersburg, Russia, e-mail: ovchreremisina@yandex.ru
3 Scientific Research Laboratory of JSC Omega, 61, Liteiny Prospect, 191014 St. Petersburg, Russia
Abstract: Possibility was shown to apply Raman-scattering spectroscopy for evaluating the number of peroxide groups in the perfluoropolyether polyperoxide molecule formed in the process of producing perfluoropolyether fluids. Wave numbers for perfluoropolyether fluids and hydrogen peroxide were determined. It was shown that Raman-scattering spectroscopy can be applied for the analytical control of the synthesis of perfluoropolyether-type products.
Keywords: Organofluorine compounds, fluorine, perfluoropolyether polyperoxide, Raman-scattering spectroscopy.
In 60s of the last century concurrently in Italy and USSR were started the studies of the reaction of low-temperature oxidation of halogenated olefins with halogen atoms immediately adjacent to the double bond. It was revealed that halogenated polyether polyperoxides can most readily be obtained by low-temperature oxidation of tetrafluoroethylene (TFE), hexafluoropropylene (HFP) and vinylidene chloride. Perfluoropolyether polyperoxide (PFPP) produced by low-temperature liquid-phase oxidation of HFP is the parent material for obtaining perfluoropolyether of irregular structure [1].
Perfluoropolyether fluids (PEF) are applied in different areas, particularly in aircraft building, rocket production and vacuum engineering for aggressive conditions.
They are distinguished by high radiation resistance, high tolerance to oxidation and heating, superb chemical inertness, wide range of viscosity and density, complete incombustibility and nontoxicity.
General chemical formula of the molecule of PEF-type perfluoropolyether fluid is
CF3-O-(C3F6-O)P-(CF2-O)Q-[CF(CF3)-O]R-CF3
wherein P, Q and R are numbers in a range from 1 to 50.
The process of producing perfluoropolyether fluids PEF comprises the following main stages [2]:
- synthesis of PFPP by means of low-temperature liquid-phase oxidation of hexafluoropropylene;
- thermal destruction of peroxide fragments;
- fluorination of end groups;
- obtaining the final product by vacuum rectification.
Analytical control plays an important role in the technological process of producting perfluoropolyether fluid (PEF) with least discharge coefficients.
One of the most important analytical control parameters requiring particular attention is the number of peroxide groups in the PFPP molecule (“active oxygen”). By the value of this parameter one can judge both the intensity of the low-temperature liquid-phase oxidation of hexafluoropropylene (a large amount of peroxide groups points to a decrease in the process intensity) and the process safety degree (the less “active oxygen”, the higher the process safety).
The content of “active oxygen” in PFPP is currently determined by iodometry [1]. Among the principal disadvantages of this technique are:
-time-consuming preparation of reagents;
-long time of analysis (about 2 hours since taking a sample);
-one of reactants, acetic anhydride, is applied as the acetylating agent in producing a number of narcotic substances (this involves difficulties with acquiring, accounting and storage of the mentioned reagent).
In this study it was proposed to apply combinational scattering method with modified optical scheme of the selection of scattered emission as analytical control technique. Combinational scattering method (Raman spectroscopy) is the most informative method in analyzing a substance of variable composition with dynamically changing radicals due to occurring chemical reactions [3].
Raman-scattering spectroscopy relates to oscillation molecular spectroscopy which allows one to detect oscillations arising in molecules due to the displacement of nuclei from the equilibrium position. Vibration spectra are registered in the form of infrared spectra and Raman spectra.
Combinational scattering spectrum, or Raman spectrum, arises as a result of the illumination of a substance with monochromatic light of UV or visible range.
Under the action of light molecules of the substance are polarized and diffract the light. As this takes place the scattered light differs by frequency from the starting irradiation by a magnitude corresponding to the frequency of normal molecular vibration. The individuality of this characteristic causes high selectivity of the method [3, 4].
Raman spectroscopy provides a mean of obtaining an individual spectral imprint which is unique to the molecule under consideration, or whole molecular structure. Compared to IR Fourier spectroscopy, Raman spectroscopy provides the following significant advantages:
-the intensity of spectrum lines in a solution is directly proportional to the concentration of specific compounds;
-Raman spectrum is independent of changes in the solution temperature;
-the technique essentially does not involve sample preparation, requires no reactants, and is not influenced by the cell material, i.e. glass;
-the application of Raman spectrometers permits one to reach high resolution and sensitivity unachievable for IR Fourier spectrometry [5].
These advantages, conditioned by the specific nature of the method, make Raman-scattering spectroscopy a potent mean for analysis and monitoring of the chemical composition, since each compound has its own unique spectrum. Depending on the instrumental equipment applied this technique can be employed for the analysis of solids and solutions, and provide information on physical characteristics of the medium under study.
Raman-scattering spectroscopy permits the identification of fast process of photon reemission. If the photon energy is insufficient to transfer a molecule to a steady excited state, there occurs emission of photon of other frequency corresponding with the energy state to which molecule’s outer electronic level turns with subsequent photon emission, i.e. the incident emission is scattered with higher or lower frequency. That is the molecule turns to unsteady excited state from which a photon is emitted after a short time [3]. Fig. 1 represents the general scheme of energy exchange in the case of the interaction of photons with substance molecules.
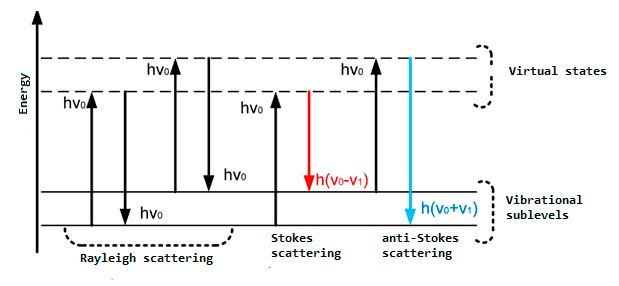
Fig.1 – General scheme of energy exchange between photons and substance molecules
It is most convenient to explain the origin of this phenomenon in terms of the quantum theory, according to which emission of ν frequency is considered as a flux of photons having energy hν, where h is Planck’s constant. As a result of collisions with molecules photons are scattered. In the case of elastic scattering photons deviate from the moving direction without changing their energy (Rayleigh scattering). However, the collisions can also result in an exchange of energy between a photon and a molecule. In so doing the molecule can either gain or lose a part of its energy in accordance with quantization rules, i.e. its energy changes by ΔE value – the difference of energies of two allowed states. In other words, ΔE value equals a change in the vibrational and/or rotational energy of a molecule. When a molecule gains energy ΔE, a photon after scattering will have energy hν– ΔE, and, correspondingly, emission frequency of ν– ΔE/h. If a molecule loses energy ΔE, emission frequency will be equal to ν + ΔE/h. Emission scattered with frequency lower than that of incident light is referred to as Stokes emission, and emission with a higher frequency is called anti-Stokes emission. At moderate temperatures the population of the 1st vibrational level is not high; at normal temperature at vibrational frequency of 1000 cm–1 only 0.7% of molecules are on the first vibrational level, and therefore the intensity of anti-Stokes scattering is low. With an increase in temperature the population of the excited vibrational level increases, and the intensity of anti-Stokes scattering grows, too. In order to enhance the resolving power and sensitivity of Raman-scattering spectroscopy optical scheme, shown in Fig.2, was applied.
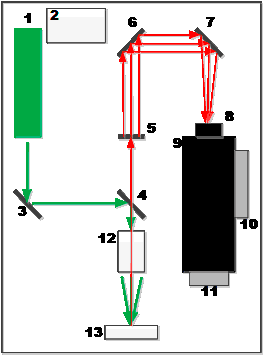
Fig.2 – Optical scheme of Raman spectrometer
1 – laser (532 nm wave length), 2 – laser’s power unit, 3 – reflecting mirror, 4 – reflecting mirror semitransparent for 532-nm ray, 5 – collimator non-transparent for 532-nm ray, 6,7 – reflecting mirror collimators, 8 – condenser, 9 – spectrometric monochromator with a Hamamatsu detector, 10 – Peltier’s cooling unit, 11 – USB interface, 12 – objective condenser,13 – sample under investigation.
The general principle of the applied scheme of a Raman spectrometer is as follows. Having got into the instrument, the laser’s beam flux is reflected from the mirror (3) and comes to the optical filter (4). The optical filter, serving as a mirror for the incident flux, directs the flux to the sample under investigation through the objective condenser. Emission scattered by the sample returns back to the filter (4) transmitting only inelastically scattered light. The flux of scattered light passes through the collimator (5) non-transparent for 532-nm ray to the reflecting mirror collimators (6, 7). The spectrometric monochromator’s diffraction grating decomposes the light into a rainbow which is analyzed by a Hamamatsu detector (9).
This scheme allows varying the laser power from 10 to 100% of the input power and changing the focus position by moving the sample under study within a distance range from 1 to 40 mm from the objective condenser.
Prior to conducting quantitative analytical measurements of a substance optimum control conditions must first be chosen. In this case it is necessary to determine laser power and find such a distance from the sample to the objective which would provide maximum analytical effect.
Changes in the spectra intensity with the variation of the emission power are displayed in Fig. 3 (PEF-240 being taken as the sample under study).
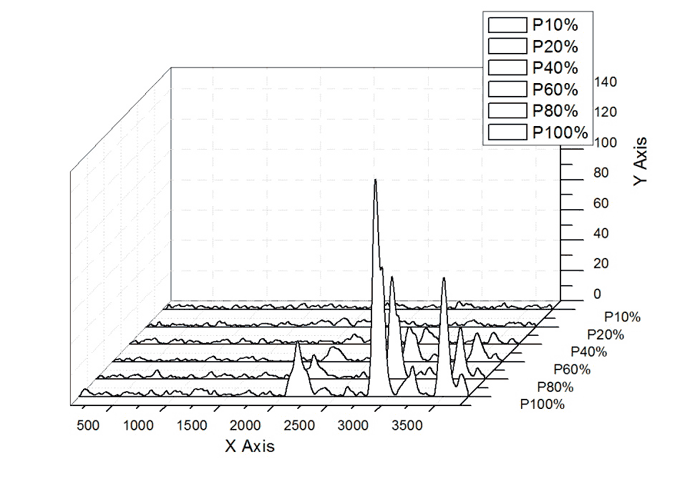
Fig.3 – Changes in the spectra intensity with the variation of the emission power from 10 to 100%
Changes in the spectra intensity with the sample distance (mm) from the objective are shown in Fig.4 (PEF-240 being taken as the sample under study).
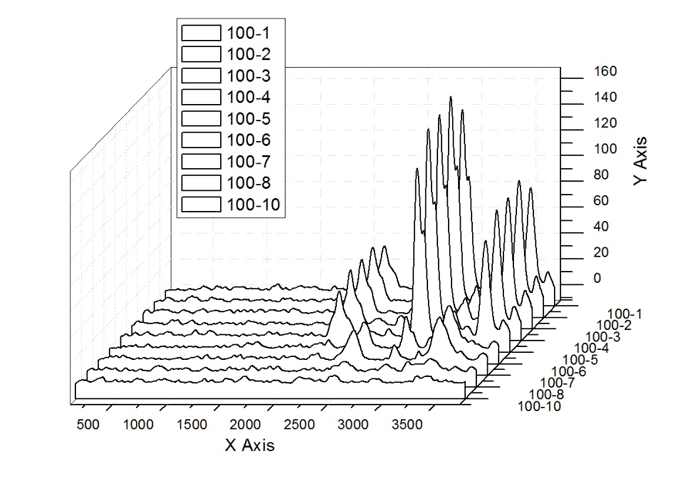
Fig.4 – Changes in the spectra intensity with the sample distance (mm) from the objective
Preliminary studies on the determination of optimum measurement conditions exhibited that the laser power must be adjusted on the level of full irradiation (200 mW), and the samples must be fixed at a distance of 3 to 6 mm.
To explore the possibility of the application of Raman-scattering spectroscopy for the determination of the number of peroxide groups in the PFPP molecule several synthesized PFPP samples were investigated whose principal characteristics are given in Table 1.
Table 1 – Principal characteristics of PFPP samples.
|
Sample No. |
Amount of active oxygen, % |
Kinematic viscosity, cSt |
|
PFPP-1 |
0.42 |
56 |
|
PFPP-2 |
0.4 |
63 |
|
PFPP-3 |
0.56 |
56 |
|
PFPP-4 |
0.34 |
78 |
In Figs. 5–8 is shown a comparison of starting PFPP spectra with spectra of the same samples heated at 200°C for 2 h
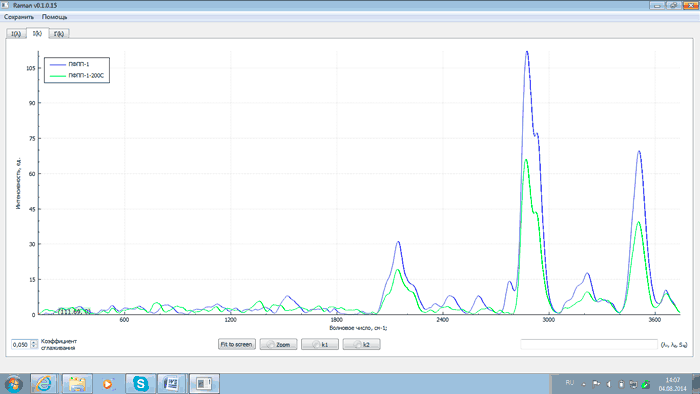
Fig.5 – Spectra of PFPP-1 after synthesis (blue) and after thermal destruction (green)
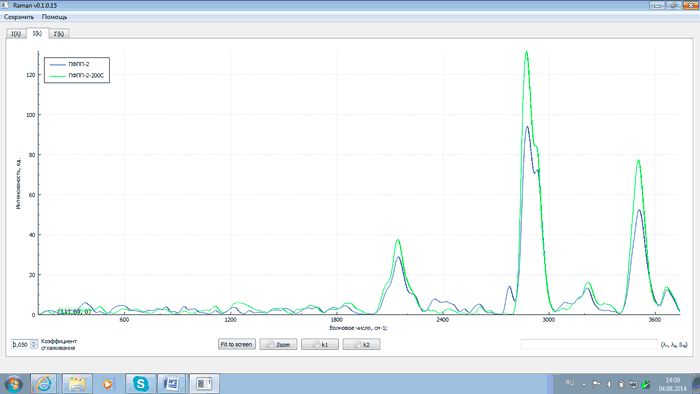
Fig.6 – Spectra of PFPP-2 after synthesis (blue) and after thermal destruction (green)
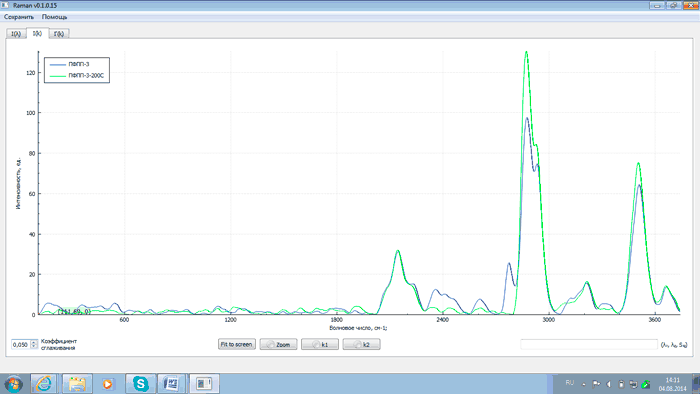
Fig.7 – Spectra of PFPP-3 after synthesis (blue) and after thermal destruction (green)

Fig.8 – Spectra of PFPP-4 after synthesis (blue) and after thermal destruction (green)
An analysis of the above plots exhibits that after heating PFPP samples to 200°C and proper exposure the intensity of analytical lines with wave numbers of 2143, 2871, 3503 and 3659 cm–1 changes (either grows or falls) as related to that of the starting products. This is explained by the recombination of PFPP radicals formed during the thermal destruction of peroxide bonds. At the same time the intensity of the line with the wave number of 2775 cm–1 decreases. This is due to the elimination of peroxide groups as a result of heating, which is confirmed by comparing spectra of PFPP-1 before and after thermal destruction with a spectrum of hydrogen peroxide (H2O2). The comparison of the spectra is shown in Figs 9 and 10.
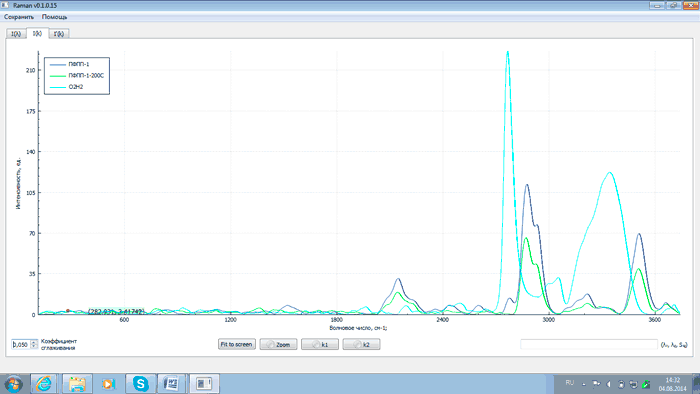
Fig.9 – Comparison of spectra of PFPP-1 before (dark blue) and after thermal destruction (green) with spectrum of hydrogen peroxide (light blue)
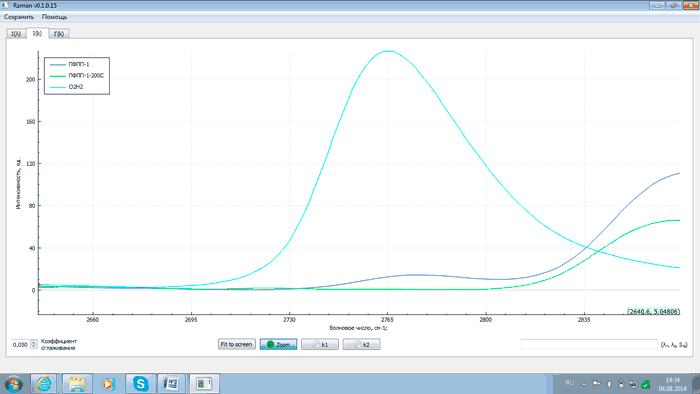
Fig.10 – Comparison of spectra of PFPP-1 before (dark blue) and after thermal destruction (green) with spectrum of hydrogen peroxide (light blue) (the intensity of the line with wave number of 2775 cm–1)
The main characteristics of PFPP samples after thermal destruction are given in Table 2 (the amount of “active oxygen” was determined by iodometry).
|
Sample No. |
Amount of active oxygen, % |
Kinematic viscosity, cSt |
|
PFPP-1 |
0.0023 |
106 |
|
PFPP-2 |
0.0015 |
128 |
|
PFPP-3 |
0.0014 |
134 |
|
PFPP-4 |
0.0021 |
148 |
As a result of analytical experiments it was revealed that Raman-scattering spectroscopy enables one to control the number of peroxide groups in the molecule of PFPP after thermal destruction and disclose correlation of such characteristics as the amount of active oxygen and kinematic viscosity with the intensity of characteristic lines in Raman-scattering spectra with excitation with a wave length of 532 nm. Measurements in the area of wave number of 2775 cm–1 permit exercising analytical control of the technological process of producing PEF fluids. Thus Raman-scattering spectroscopy can be applied as a method of analytically controlling the number of peroxide groups in the PFPP molecule.
References
- Shapovalov, V.V., Poluektov, V.A. and Ryabinin, N.A. Kinetika I mekhanizm zhidkofaznogo nizkotemperaturnogo okisleniya geksaftorpropilena (The kinetics and mechanism of liquid-phase low-temperature oxidation of hexafluoropropylene). Chemical Kinetics and Catalysis, 1984, vol. LVIII, p. 540-545.
- Maksimov, B.N., Barabanov, V.G., Serushkin, I.L, et al. Promyshlennye ftororganicheskie produkty (Industrial Organofluoric Products) Leningrad: Khimiya., 1990, .
- Landsberg, G.S., Mandel’shtam, L.I., Novoe yavlenie pri rasseyanii sveta (A Novel Phenomenon with Light Scattering) Moscow: Izdatel’stvo Akademii Nauk SSSR, 1928.
- Guseva, E.V., Mel’nikov, F.G., Orlov, R.Yu., Uspenskaya, M.E., Spektroskopiya KR sveta dlya analiza gazovo-zhidkikh vklyuchenii (Raman-scattering spectroscopy for analyzing gas-liquid inclusions), Moscow: Nauka, 1985.
- Suschinskii, M.M., Spektry kombinatsionnogo rasseyaniya molekul i kristallov (Raman spectra of molecules and crystals), Moscow: Nauka, 1969.
Recommended for publication by Prof. A. F. Eleev
Fluorine Notes, 2015, 98, 7-8