Fluorine Notes, 2010, 71, 3-4
Analysis of composition and microstructure of copolymers of tetrafluoroethylene with perfluoromethylvinyl ether according to NMR 19F data
N. Lebedev, M. Juravlev, V. Berenblit, J. Sokolov, V. Lovchikov, M. Volkova, V. Gubanov
Federal State Unitary Enterprise S.Y. Lebedev Research Institute for synthetic rubber (FSUE NIISK)
Gapsalskaya ave 1, St.-Petersburg, 198035, Russia
Abstract:19F NMR spectra of copolymers of tetrafluoroethylene (TFE) and perfluoromethylvinyl ether (PFMVE) were investigated. Based on the 19F NMR spectra by two techniques calculated compositions of copolymers of TFE/PFMVE. Both techniques gave good convergence. Markov first-order model for radical copolymerization of TFE and PFMVE was considered.
Keywords: 19F NMR spectra, copolymers, tetrafluoroethylene (TFE). perfluoromethylvinyl ether (PFMVE), Markov first-order model
NMR method is widely used to find out the regularities of forming the polymers microstructure and for other structure studies. First work regarding studying the synthesized in the institute copolymers of trifluorochloroethylene and vinylidenfluoride by analysis of NMR spectra of high resolution at nucleus 19F was published in 1958 [1]. It had appeared before the Saunders article [2], and more than a year earlier than Odadzima’s work [3] and classical article by Bovie and Tirse [4] considered to be the first publications regarding NMR of high resolution of polymers in the world. In that works a fundamental fact had been established: NMR of high resolution is an absolute method of defying the sequencies of configurations in polymer’s chain. That circumstance had initiated the development of theoretical ideas about the process of copolymerization, its description methods and methods of appreciation of alternation of monomers links in macrochain [5].
NMR 19F spectra of fluoropolymers is of a special interest. Their analysis at frequency of 470.6 MHz allows identifying and correlating the fields of resonances up to γ-encirculments of fluorine nucleuses of macromolecular chain, which gives the opportunity to define the composition, mosaicity and to prove the possible mechanism of copolymerization.
Studying of structure and composition of copolymers of tetrafluoroethylene (TFE) with perfluoromethylvinyl ether (PFMVE) using NMR 19F method firstly had been presented in work [6], where spectra of insufficiant resolution of copolymers taken at the frecuency of 84.7 MHz were considered.
In NMR 19F spectra of copolymers of TFE/PFMVE we can observe the resonance of fluorine atoms of CF2-groups of TFE units, CF2- and CF-groups of units of PFMVE of main chain, CF3O-groups of side chains of PFMVE. At Pic. 1 a spectra of copolymer of TFE/PFMVE is listed (taken at frequency of 470.6 MHz), in which three fields of resonance are isolated: CF3O-, CF2- and CF-groups.
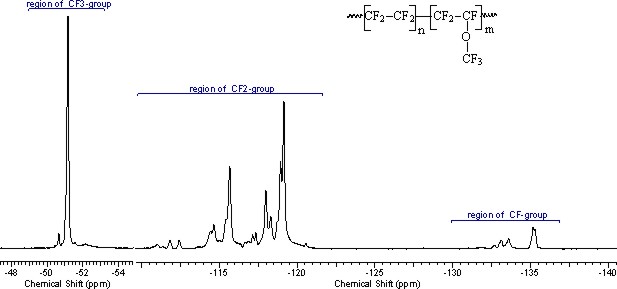
Picture 1. NMR 19F (470.6 MHz) spectra of TFE/PFMVE copolymer .
In common case the number of PFMVE units in copolymer specify the intensity of CF2-groups in chain equal to double sum of signals of intensities of CF-group (SCF), resonating in -132 - -136 ppm chemical shifts field. Respectively, the half of sums’ diiference of CF2-groups (SCF2) signals intensity in the field of chemical shifts -110 – -123 ppm and doubled sum of CF-groups (SCF) signals intensities responds to the number of units of teterafluoroethylene. Then the total number of monomer units in copolymer chain is:
Analogously, the overall number of monomer links in copolymer chain can be calculated through the intensity of CF3O-group resonance:
The composition of TFE/PFMVE copolymer can be calculated in two different ways. In the first one the molar content of PFMVE was calculated by doubled intensity of chain signal of CF-group (SCF) in regard to number of monomer units in chain N according to equation
 (1)
(1)
And molar percentage of TFE according to equation
 (2)
(2)
In second one the molar percentage of PFMVE was estimated by 2/3 intensity of signal of CF3O-group (SCF3О) in regards to number of monomer units in chain N according to equation
 (3)
(3)
And molar percentage of TFE according to equation
 (4)
(4)
In accordance with condition of normalization the sum [PFMVE] + [TFE] = 1. In case of low content of ether units in copolymer the intensity of CF-groups signals becomes non-significant, which can lead to mistake in calculation using formulas (1) and (2) due to integration mistake. The corresponding square of CF3-group signal of side chain is 3 times more than the square of CF-groups backbone chain signal and can be intergrated with high precision. In that case it is preferable to use formulas (3) and (4).
For spectra of copolymers taken at frequency till 187 MHz at graphic integration both of methods produced virtually the same results [7]. However, as our studies have proved, at analysis of spectra taken at impulse regime at frequency of 470.6 MHz not only the dependency of signals intensity on fluorine nucleuses number should be taken into account but on the chemical shift of signal as well. The alteration of chemical shift for -10 ppm to the strong field side increases the intensity of signal by 1%. As CF3O-group resonates in the field of -51 ppm, and chain CF2- and CF-groups in the field of -110 – -136 ppm, at comparison of calculation by first and second methods the composition’s deviation were observed.
A thin structure in the field of CF2-groups resonances can be also used to calculate the composition of copolymers, this structure reflects β,γ-encirclement, where three groups of signals clearly appear, the rate of intentisities of which change depending on rate of monomers’ units in copolymer (Pic. 2).
Bringing the intensities of signals to the overall number of monomer units in N, we will assume, that the field of S1 in interval within the range of -117 – -122 ppm correspond the intensity S1, which noticeably intensifies with increasing of TFE content in copolymer. Based on ideas regarding influence of α-environment on the size of chemical shift of CF2-group this group of signals can be considered to refer to the structure of ~CF2CF2CF2~. This structure includes signals of CF2-groups in TFE blocks and CF2-group signals of TFE units, which is connected with CF2-group of PFMVE into structure:
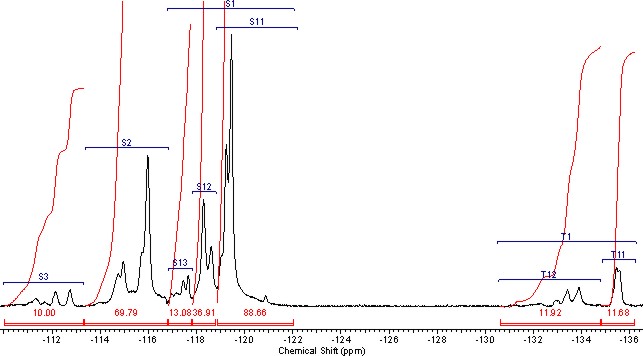
Picture 2. The Field of Resonances of CF2-groups and CF-groups in NMR19F Spectra of Copolymer А-27 TFE/PFMBE.
Accordingly to listed intensity S2 increasing with rising of PFAVE content in copolymer the signals of CF2-group in S2 field correspond in the interval -113 -117 ppm, which refer to structures, when TFE unit is bound into dyad with CF-group of perfluoroalkyl vinyl ethers (PFAVE), or the resonancing CF2-group belongs to the unit of PFMVE block in the "head to head" position:
 and
and 
The signals of the following group resonating in the interval S3 within -110 -113 ppm correspond to the intensity S3, which refer to CF2-groups of PFAVE blocks in "head to tail" position in structure:
In that field the appearance of several signals is accompained by analogous complexification of structure of CF-groups signals in corresponding to them field of T1of chemical shifts -131 – -136 ppm, which probably belong to the resonances of CF-group locating between two CF2-groups in structure
 , reduced intensity of which is marked as T1. Such structure
appears in case, when PFAVE forms a dyad with TFE
, reduced intensity of which is marked as T1. Such structure
appears in case, when PFAVE forms a dyad with TFE
 ,
or triad with TFE in the middle , or blocks in "head to tail" positions:
,
or triad with TFE in the middle , or blocks in "head to tail" positions:
 and "head to head"
Intensity and splitting of signals in S3 and T1 increases at rising of PFMVE content in copolymer. Probably the structure of spectra lines is due to the different spatial disposition of side chains of perfluoroalkylvinyl ethers in regards to backbone polymer chain.
It can be supposed, that in the field of more negative chemical shifts of T2 intensity neighboring CF-groups must resonate in "tail to tail" position. However, because of spatial difficulties the forming of structures
should be considered rather unlikely, that is confirmed by the absence of T2 resonances in the spectrum of field.
Let’s denote by:
x1–the molar content of TFE dyads equal to its doubled molar content in ~CF2C*F2C*F2CF2~
structure;
x2– the molar content of PFMVE dyads and combined with its CF2-group
of TFE equal to molar content of every monomer in structure ;
;
x3 – molar content of PFMVE and TFE dyads combined with CF-group
in structure  also equal to molar content of every monomer;
x4 – molar content of PFMVE blocks equal to its doubled share in structure of “head
to tail” ;
;
x5 – molar content of PFMVE blocks equal to its doubled mole in structure of “head
to head” ;
;
x6 – molar content of PFMVE blocks equal to its doubled molar content in structure of “head to head”
 .
.
Then in the range of resonances of CF2-group the molar content of structures resonating in
the field of S1is proportional to molar content of TFE and equal to .
.
Correspondingly, in the field of S2 the molar content of TFE is equal to ,
while the molar content of PFMVE is proportional to S2and equal to
,
while the molar content of PFMVE is proportional to S2and equal to .
.
In the field of S3the molar contentof
PFMVE bis equal to x4 + x6.
For the field of T1, where CF-groups resonate, molar content of PFMVE is proportional to its
doubled intensity and equal to .
.
For the field of T2 the molar content of PFMVE is equal to x6 = 0, in accordance with all said above.
We’ll present the offered dependancies of molar contents of TFE and PFMBE in copolymer in the form of table as the functions of reduced intensities of resonances (Table 1).
Table 1. The Correspondance of Mole Shares of Dyades of TFE and PFMVE to Listed Intensities of NMR19F Spectrum Signals
Monomers’ molar contents in copolymer dyads are proportional to overall intensity of chain resonances of spectra S1+S2+S3+T1+T2, brought to 2N, that’s why according to normalization condition the sum of molar content of monomers is equal to:
[TFE] + [PFMVE] = S1 + S2 +
S3 + T1 + T2 = 1
or x1+x2+x3+x4+x5+x6=
1
Molar content of PFMVE in copolymer of TFE/PFMVE is equal to:
 (5)
(5)
Molar content of TFE in copolymer of TFE/PFMVE is equal to:
 (6)
(6)
Then
2[TFE] + [PFMVE] = 2S1 + x3 + 2S2- x3 + 2S3 = 2S1+ 2S2 + 2S3.
Whence from the condition of normalization:
[TFE] = 2(S1+ S2+ S3) – 1 = 2SCF2 – 1 (7)
[PFMVE] = 2 - 2SCF2, (8)
Or by the condition of normalization: [PFMVE] = 1 - [TFE].
It can be proved, that analytical equation (7) is summarized to the equation (2):
And the calculation of polymer composition totally corresponds to the calculation by formulas (1) – (2) confirming the correspondance of ideas on comparing the groups of spectra signals and structural fragments in copolymer.
NMR 19F spectra were registered at Bruker Spectrospin AM-500 apparatus (frequency is 470.6 MHz) at room temperature (19-21oC). 5% and 10% solutions of copolymer in hexafluorobenzole were used for registration. Spectra recording conditions: impulse delay - 11.3 μs, impulse width - 5 μs, 500-1000 accumulations.
Calculation of average meanings for 40 samples of copolymer by listed above methods leads to satisfactory result, when the deviation of TFE is 1.5% mole, and maximum one reaches 3.5%. At that, by the increasing of TFE content in the composition of copolymer the growth of deviation is observed (Diagram 1).
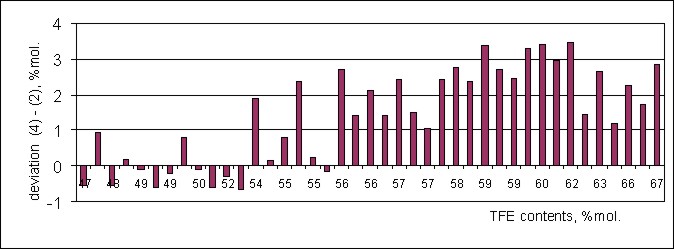
Diagram 1. Deviation of Mole Share of TFE (% mole) During Calculation by Formulas (4) – (2) in The Order of Increasing of TFE Content in Samples of TFE/PFMVE in The Range of 47-67% Mole.
It is obvious, that mismatching of calculation by different methods is due to dependancy of spectra signals intensity not only on number of fluorine atoms, but also on chemical shift of the signal. That is due to the "apparatus" mistake of the instrument at registrating of spectra at impulse regime on 19F nucleuses, which had been checked many times at registrating spectra of fluorine containing individual compounds including fluoromonomers. On an average, the composition of copolymer by TFE is appeared to be overstated by 2% compare to the real one (when using the same calculation methods for the copolymers of different composition). Therefore, to obtain a calculation of composition close to the real one it is necessary to introduce a correction coefficient connecting the signal intensity to the distance till reference signal in spectra.
At lowering the concentration of copolymer solution for the samples of high content of TFE (over 70%) twice (from 10% to 5%) the increasing of composition calculation results range is observed, in spite of application of pattern integration of signals. We managed to partly compensate that inaccuracy due to increasing of accumulations up to 1000 at registration of spectra. When processing the results under such conditions we should take into account the signals of admixtures containing in hexafluorobenzole, rezonating in the field of chain nucleuses of fluorine in copolymer.
The additional mismatch in calculations by different methods is due to appearances of compositional inhomogeneity of copolymers, the consequence of which is the inhomogeneity of sample in the solutions of hexafluorobenzole.
For practical purposes it is necessary to stick to one calculation method under the same conditions of spectra recording to avoid mismatches when comparing the composition of different copolymer samples.
First-order Markov model for copolymers of TFE and PFMVE
Radical copolymerization of TFE and PFMVE in the view of influence on probability of addition of monomers of the last added link and its orientation along the chain is described by three state schemes [8]:
where pij– probabilities of addition of j-monomer of one or another orientation (CF2=CF2,
(CF3O)CF=CF2 or CF2=CF(OCF3)) to i-active radical centre;
α i (i = 1,2,3) – the probability of participation in
the process of chain growth of corresponding active centre. Depending on orientation along the chain
PFMVE forms two types of active links and TFE (simmetrical monomer) only one type.
pijprobabilities
form stochastic matrix describing the transfer from one state into another:
For this matrix it is true: pi1 + pi2+ pi3 = 1 , where i = 1, 2, 3.
For it the only stochastic own vector exists:
α= (α1,α2,α3),
where α i – final probability of originating of i-го active centre or its relative concentration.
The whole process of copolymerization at any stage n is described by the grades of matrix of transfer states Pn [9]. At rather big meanings of n:
αP = α (9)
In accordance with used symbols for TFE"──" and PFMVE "┌──" we’ll designate:
[──] – the share of TFE links attached to growing macrochain;
[──┐] – the share of PFMVE links attached to growing macrochain by CF2 –group;
[┌──] – the share of PFMVE links attached to growing macrochain by CF(OCF3) –group.
Then the overall molar content of TFE in copolymer will be equal to:
(──) = [──] = α1
And, respectively, for PFMVE:
(──┐) = [──┐] + [┌── ] = α2 + α3.
In accordance with the scheme of chain growth the corresponding sum of α i pij products will correspond to every share of consequencies of two links. For example, the share of consequencies
(── ──┐)= [── ──┐] + [┌── ──]= α 1p12 + α 3p31 etc.
The proportion of combinations of dyads and copolymer compositions were defined based on analysis of NMR 19F spectra. Assignment of spectral lines yielded the system of equations connecting signals intencity with Markov model parameters of copolimerization.
The present model considers 3 possible states of macroradical and has got 6 independent parametres, as the size of matrix equals 9, and it is expected from its stochasticity: 9 - 3 = 6.
As the shares of consequencies are connected with that parametres in non-linear way it is necessary to solve the system of equations for their definition in every separate case, the quantity of equations exceeds the quantity of unknown quantities more than twice. Unfortunately, the signal intensities of CF2-groups overlap, which complicates the accuracy of their calculations. Thus, based on present spectral information it is practically hard to reach the precise solution of reverse Markov problem.
In connection with all said above a necessity arises to enlarge (average) [10] the complete Markov model by states, which corresponds to decreasing of number of independent parametres describing the process of chain growth.
The suggested procedure of enlargement starts from the unity of origin of growth states. At that, the active centres unite ending at CF2 and CF groups of PFMVE. It is obvious, that such model is connected with full markovian model by the following proportions for final probabilities:
α 1= a1
α 2+ α 3 = a2
For aggregative Markov model it is true:
From where the matrix of transition states:
 ,
for which a=(a1, a2) it's own vector.
,
for which a=(a1, a2) it's own vector.
In such model not taking into account the orientation of links along the chain the process of macromolecule will be described by matrix equation
aQ=a (10)
The connection of that equation with the equation of complete model (9) for dyad combinations of PFMVE links:
(PFMVE - PFMVE ) = (──┐──┐) + (──┐┌──) + (┌── ──┐)
are connected with parametres of aggregative model by proportion:
a2q22 = α 2p22 + α 3p33+ α 2p23+ α 3p32.
To the mixed dyads of TFE and PFMVE:
(TFE -PFMVE ) = (── ──┐) + (──┌──) the link corresponds:
a1q12 + a2q21 = α 1p12 + α 1p13 + α 2p21 + α 3p31.
Here a1 = [TFE] – corresponds to molar content of TFE,
a2 = [PFMVE ] – the molar content of PFMVE in copolymer.
Spectral information of NMR 19F is enough to define two independent parametres of aggregative model of chain growth and principal difficulties of their definition by intensities of spectra lines do not arise.
The meanings of transitional probabilities and constants of copolymerization for enlarged Markovian model of copolymerization of TFE and PFMVE (Table 3) were calculated. Average meanings of TFE anf PFMVE blocks’ lengths were listed as well.
The results of copolymers samples analysis which differ by composition and obtaining method are listed in Tables 2, 3.
The composition of copolymer is defined by formulas (1, 2).
Table 2. The Results of Analysis of Composition of Some Samples of TFE/PFMVE copolymers
Table 3. Calculation of Meanings of Transitional Probabilities for Enlarged Markovian Model of Co-Polymerization, of Average Constants of Co-Polymerization, Mosaicity Estimation by TFE And PFMVE
*Average meanings of monomers’ blocks length are equal to lTFE=1/q12 and lPFMVE=1/q21; average meanings of monomers’ blocks length with n>3 for TFE n>2 for PFMVE and their share in copolymer.
References
2. Saunders M.‚ Wishnia A. // Ann. N.Y. Acad. Sci. 1958. V. 70. P. 870.
3. Odajima A. // J. Phys. Soc. Jap. 1959. V. 14. P. 777.
4. Bovey F.A., Tiers G. V. // J. Polym. Sci. 1959. V. 38. P. 73.
5. Bovey F., NMR vysokogo razresheniya makromolekul: per. pod red. I.Ya. Slonima, M.: Khimiya, 1977. 455 s.
6. Lovchikov V.A.‚ Sass V.P.‚ Konshin A.I. i dr. // VMS. 1975. T.Б17. N 8. C. 622.
7. Sokolov Yг.P.‚ Filippov N.N.‚ Veretennikov N.V. i dr. Issledovanie stroeniya makromolekul metodom NMR vysokogo razresheniya / Sb. Nauchn. Tr. VNIISK. TsNIITENeftekhim, 1983. S. 45.
8. Lovchikov V.A.‚ Serov S.I.‚ Sass V.P. // ZhVKhO im. D.I. Mendeleeva. 1978. T. 23. N 2. S. 237.
9. Lovchikov V.A. Issledovanie mikrostruktury ftorsoderzhashchih polimerov i etilenpropilenovogo sopolimera po spektram NMR 19F i 13C. Avtoref. kand. diss. L.‚ 1982, 18 s.
10. Kemeny J.G., Snell J.L., Thompson G.L. Introduction to Finite Mathematics. Englewood Cliffs, New-Jersey. 1976. 484 p.
The research was supported by the Ministry of Education and Science of Russia Federation through a State Contract 02.523.12.3027
Fluorine Notes, 2010, 71, 3-4